
Description
.png)
 Enterprise Community Odoo.sh
Dynamic Dashboard Builder
The Dynamic Dashboard Builder module enables users to create fully configurable, model-driven dashboards in Odoo without any coding knowledge. Through an intuitive interface, users can dynamically select models and fields, apply domain filters, manage relational fields such as Many2one, One2many, and Many2many, and create calculated columns for meaningful business insights. Built for website-based visualization, the module allows dashboards to be published through customizable HTTP routes, delivering a seamless, interactive, and accessible dashboard experience. The module is further enhanced with advanced capabilities such as dynamic search filters, flexible date range selection (from–to) on user-selected fields, and static summary cards based on predefined periods like Today, Last 7 Days, and Last 90 Days. It also supports multiple field selection for generating dynamic dashboard cards, along with a quick Today Records button for instant access to current data. In addition, the module provides dynamic table rendering that automatically adapts based on selected fields, supports live updates for selection values, and offers integrated color pickers for customizing table styles and dashboard backgrounds. These features create a modern, visually engaging, and highly user-friendly dashboard solution for Odoo.
We specialize in delivering advanced Odoo solutions across multiple domains. Our expertise includes:

EDI & SWIFT/ACH Payment Integrations
End-to-end EDI automation, including X12, EDIFACT, XML standards, & financial integrations such as SWIFT, ACH, & Fedwire.


eCommerce Integrations
Seamless integration with leading eCommerce platforms to sync products, orders, inventory, and customer data in real time.

Shipping Integrations
Robust shipping connectors for global couriers, offering automated label generation, tracking, and rate computation.

Most Useful Apps for your ERP
A wide range of highly-rated Odoo modules designed to enhance automation, improve productivity, & simplify business operations.
 Features
 Process
 FAQs
FAQs
 No-Code, Model-Driven Dashboard Builder
Easily create fully dynamic dashboards without coding by selecting any Odoo model and configuring it through a user-friendly interface.
Dynamic Field Selection & Domain Filtering
Select fields dynamically and apply domain filters to refine and display only the most relevant data.
Advanced Relational Data Handling
Seamlessly work with Many2one, One2many, and Many2many fields, including structured and meaningful representation of related records.
Sub-Dashboard Support
Configure sub-dashboards for relational fields to present detailed, hierarchical, and expandable data views.
Calculated (Operational) Columns
Create custom computed columns using operations such as addition and multiplication to generate real-time insights.
Dynamic Search & Flexible Date Range Filtering
Enhance data exploration with dynamic search filters and flexible date range selection (from–to) on selected fields.
Summary Cards with Preset Date Ranges
Display instant record counters using predefined date ranges such as Last 7 Days, Last 30 Days, Last 90 Days, and more.
Today Records Quick Access Button
Quickly access and display today’s records based on the selected date field configuration.
Dynamic Selection Value Support
Allow users to dynamically select and update selection-field values for smarter filtering and interactive dashboard control.
Multi-Field Dynamic Cards
Generate dynamic dashboard cards using multiple fields to display key metrics and summarized insights.
Dynamic Table Generation with Custom Design
Automatically generate tables based on selected fields with smart formatting and adaptive layouts for better readability.
Dashboard Color & Theme Customization
Customize dashboard backgrounds and table designs using integrated color pickers for a modern, branded, and visually engaging experience.
Website Dashboard Visualization
Render dashboards directly on the website using customizable HTTP routes, enabling easy sharing and access across users.
Go to Dynamic Dashboard → Dashboard Configuration, then click on New to add a new dashboard configuration.
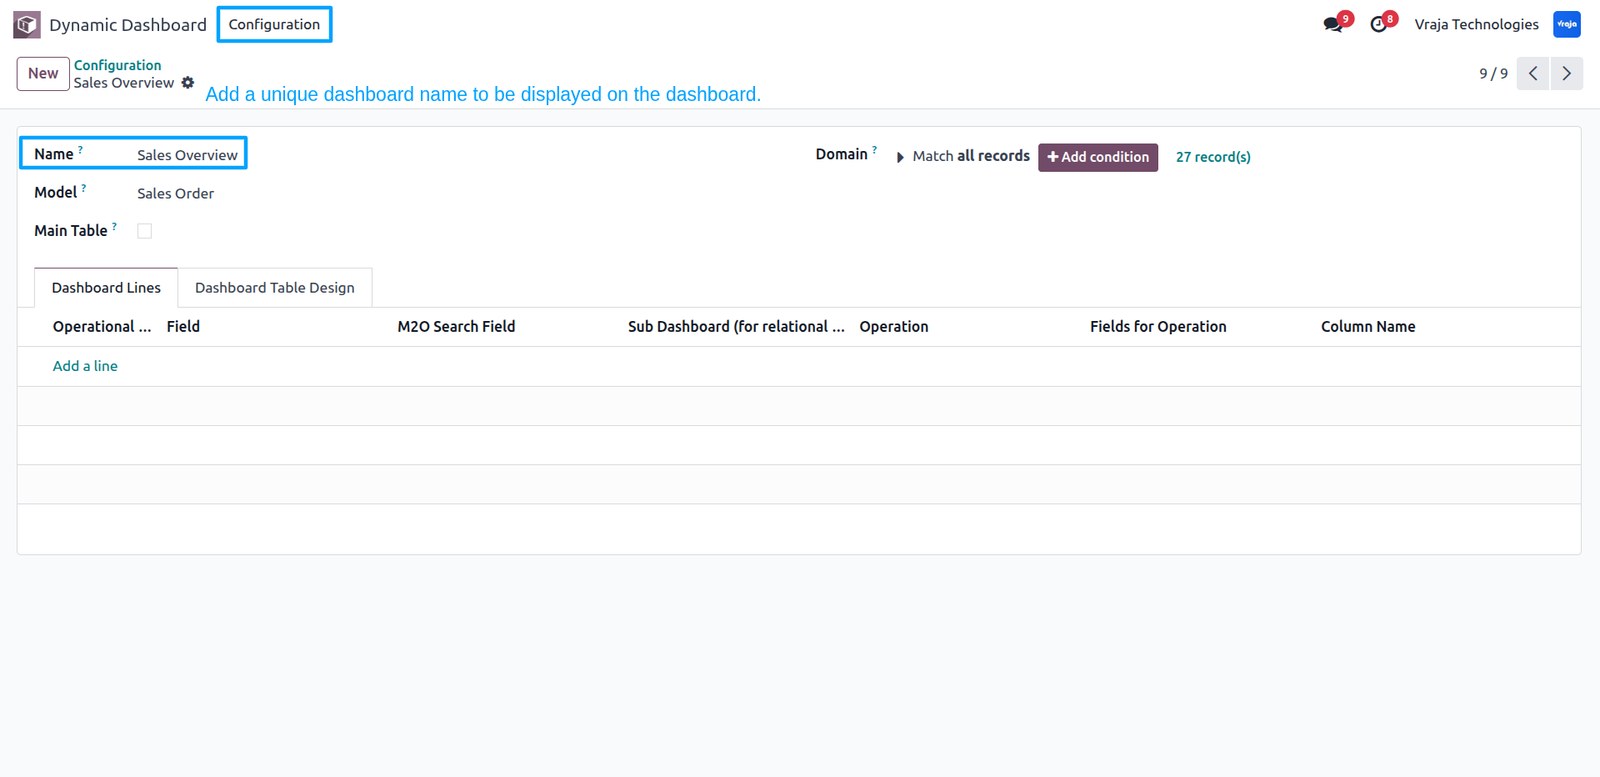
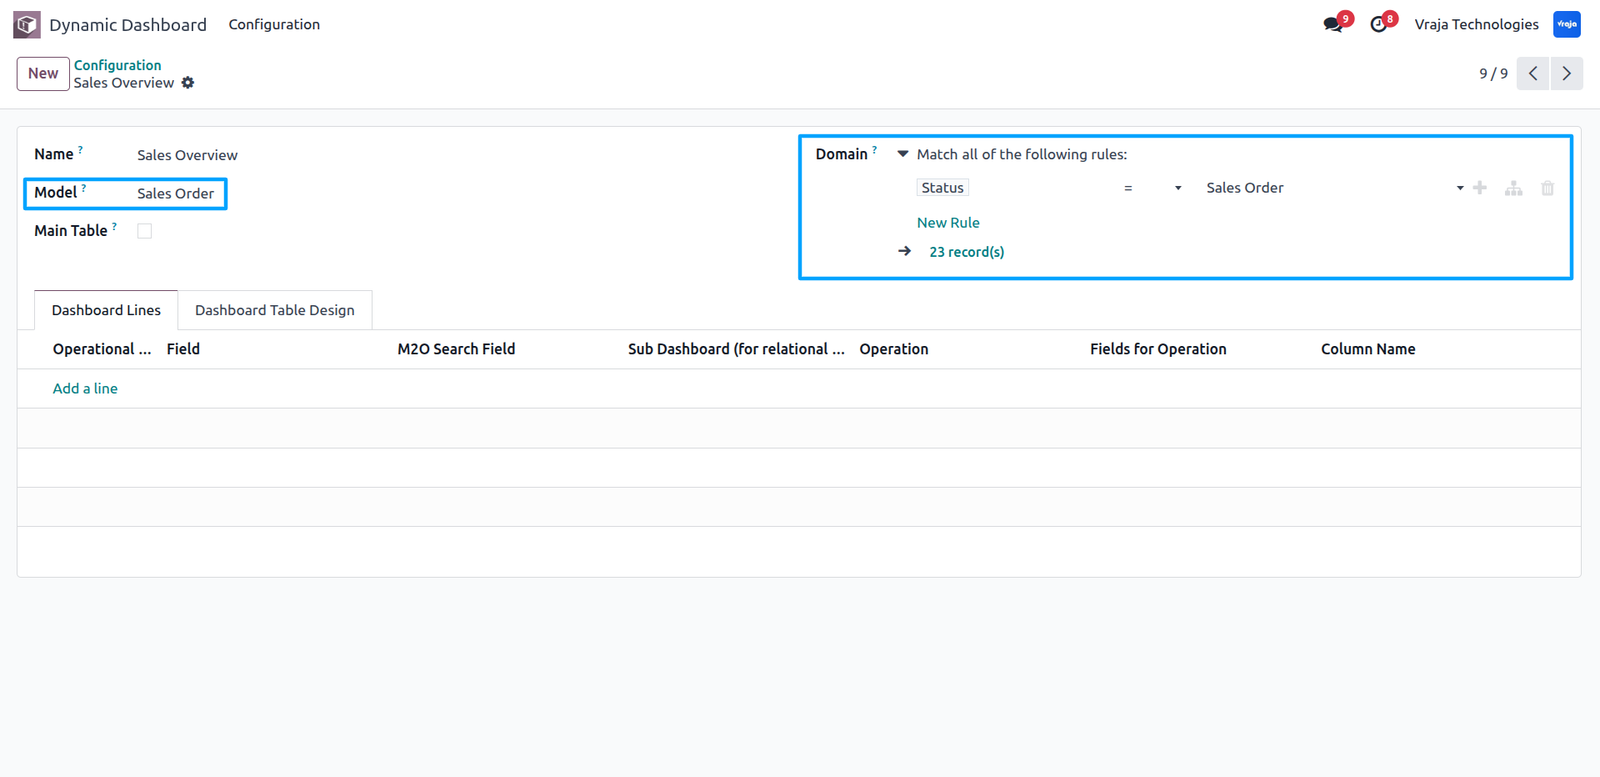
Choose the model from which you want to fetch data, then apply a domain filter to retrieve only the required records dynamically.
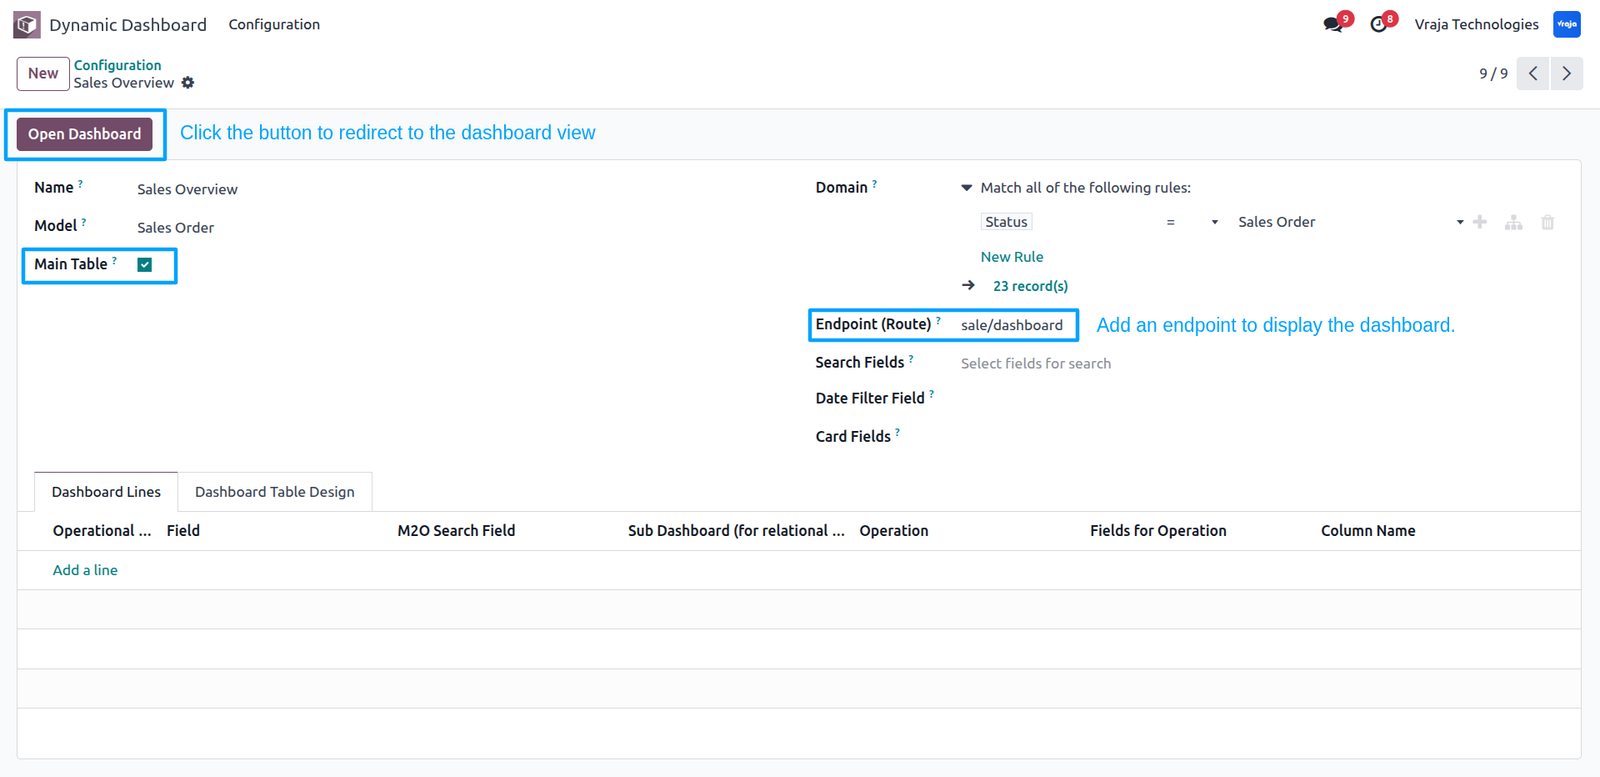
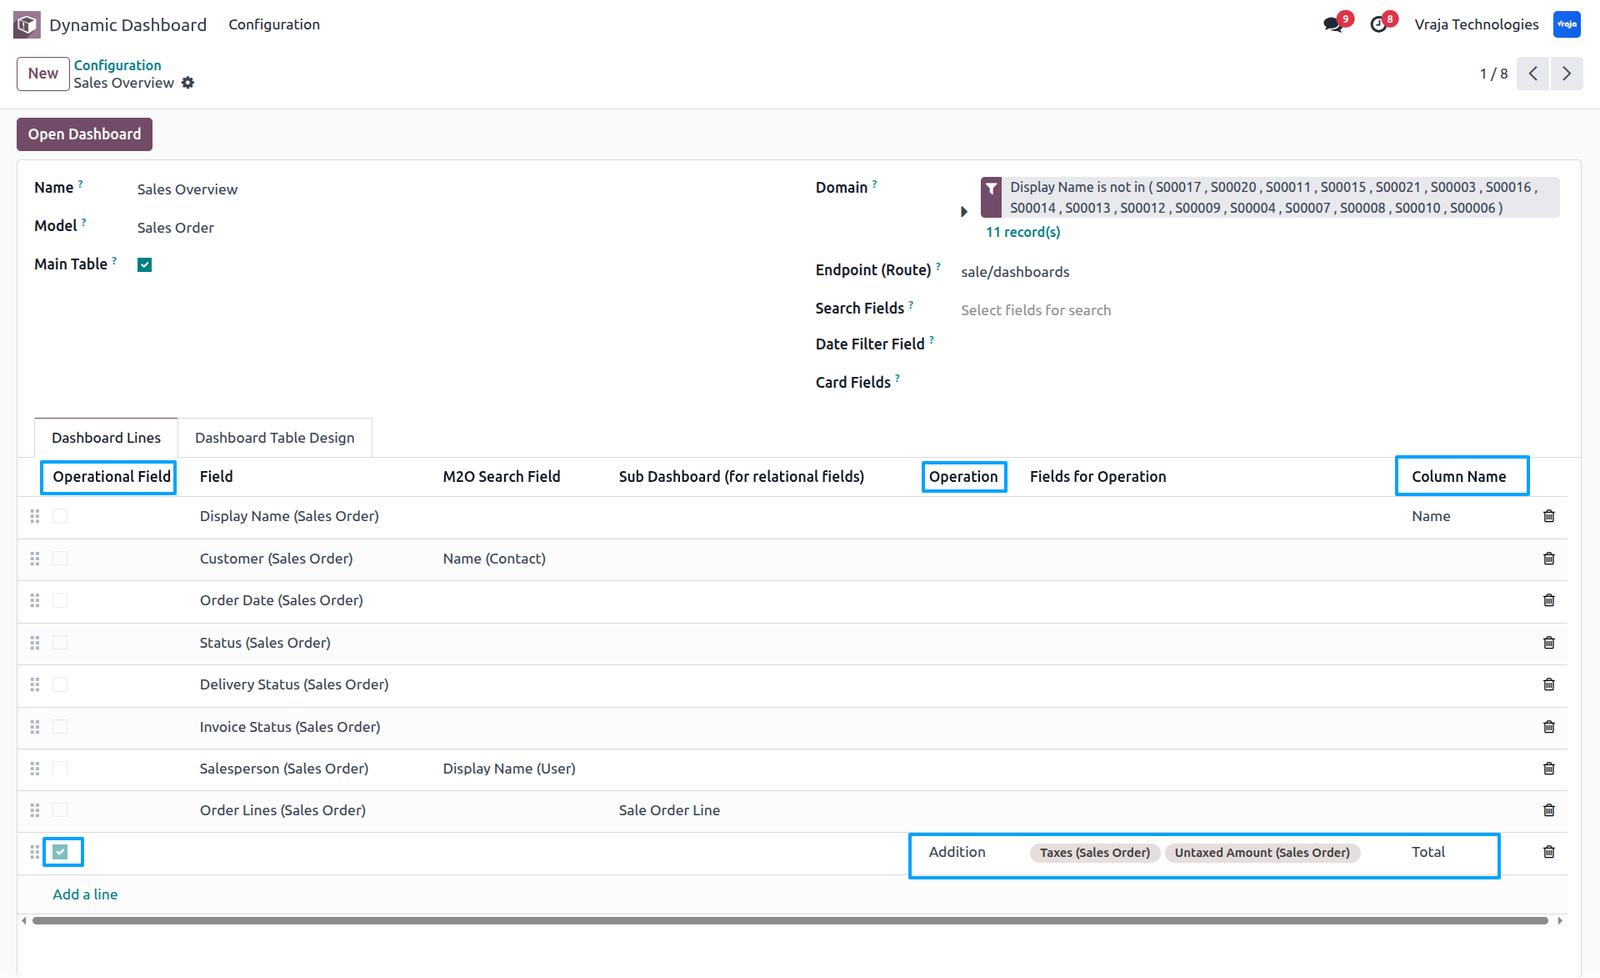
Enable the Main Table option to mark the dashboard as the primary table, then define a custom route (endpoint) for it. This endpoint will be used to access the dashboard via a URL, and an “Open Dashboard” button will appear, allowing you to quickly redirect and view the dashboard.
Inside the dashboard configuration, use the Dashboard Lines section to add fields that you want to display in the table. For Many2one fields, you can additionally select a specific field from the related model to control which value is shown in the dashboard.
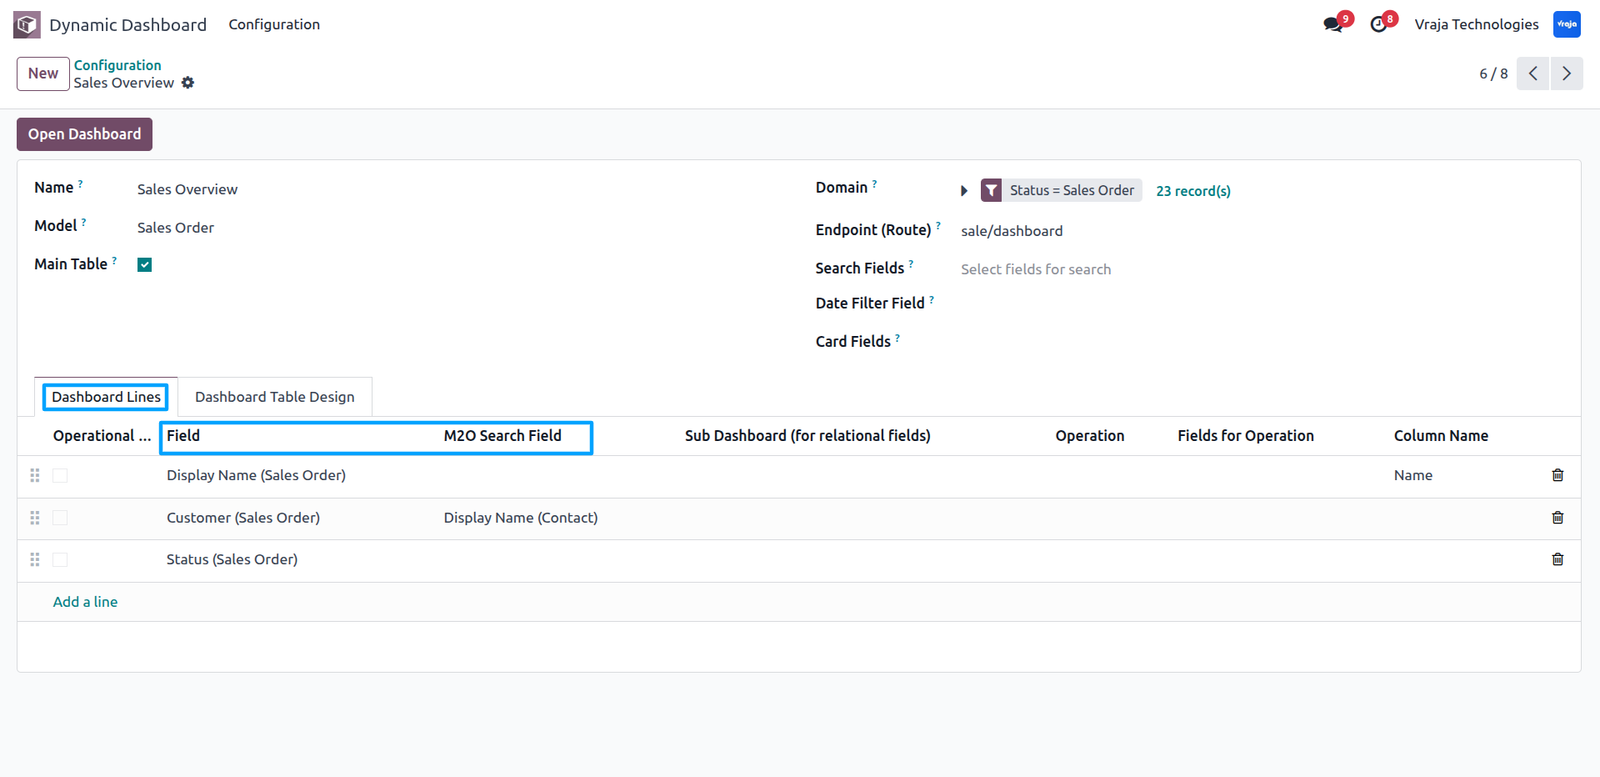
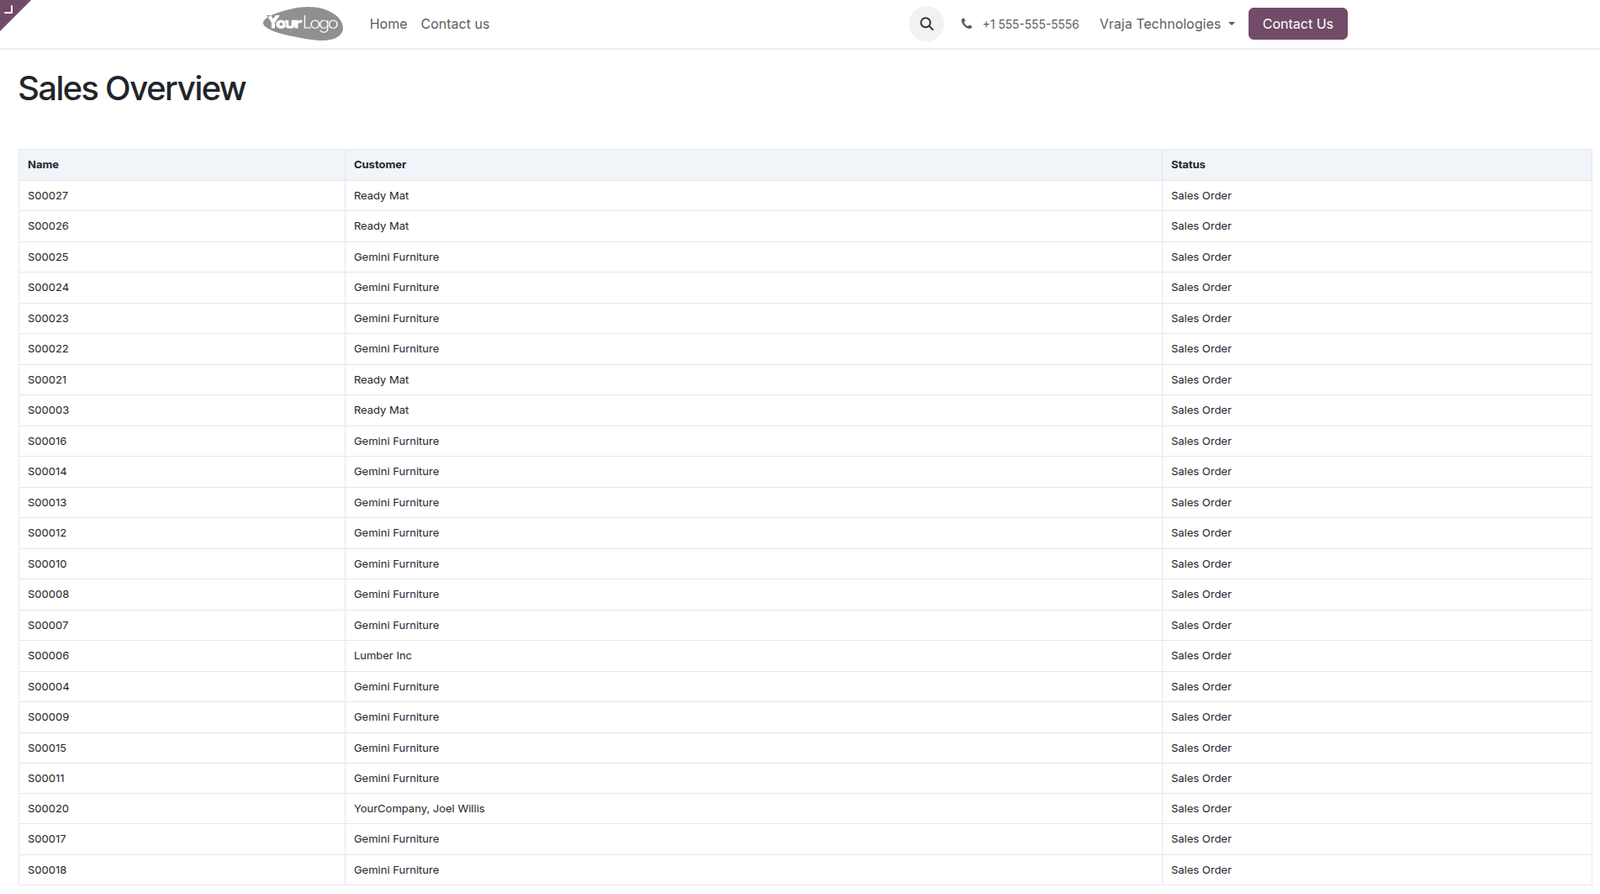
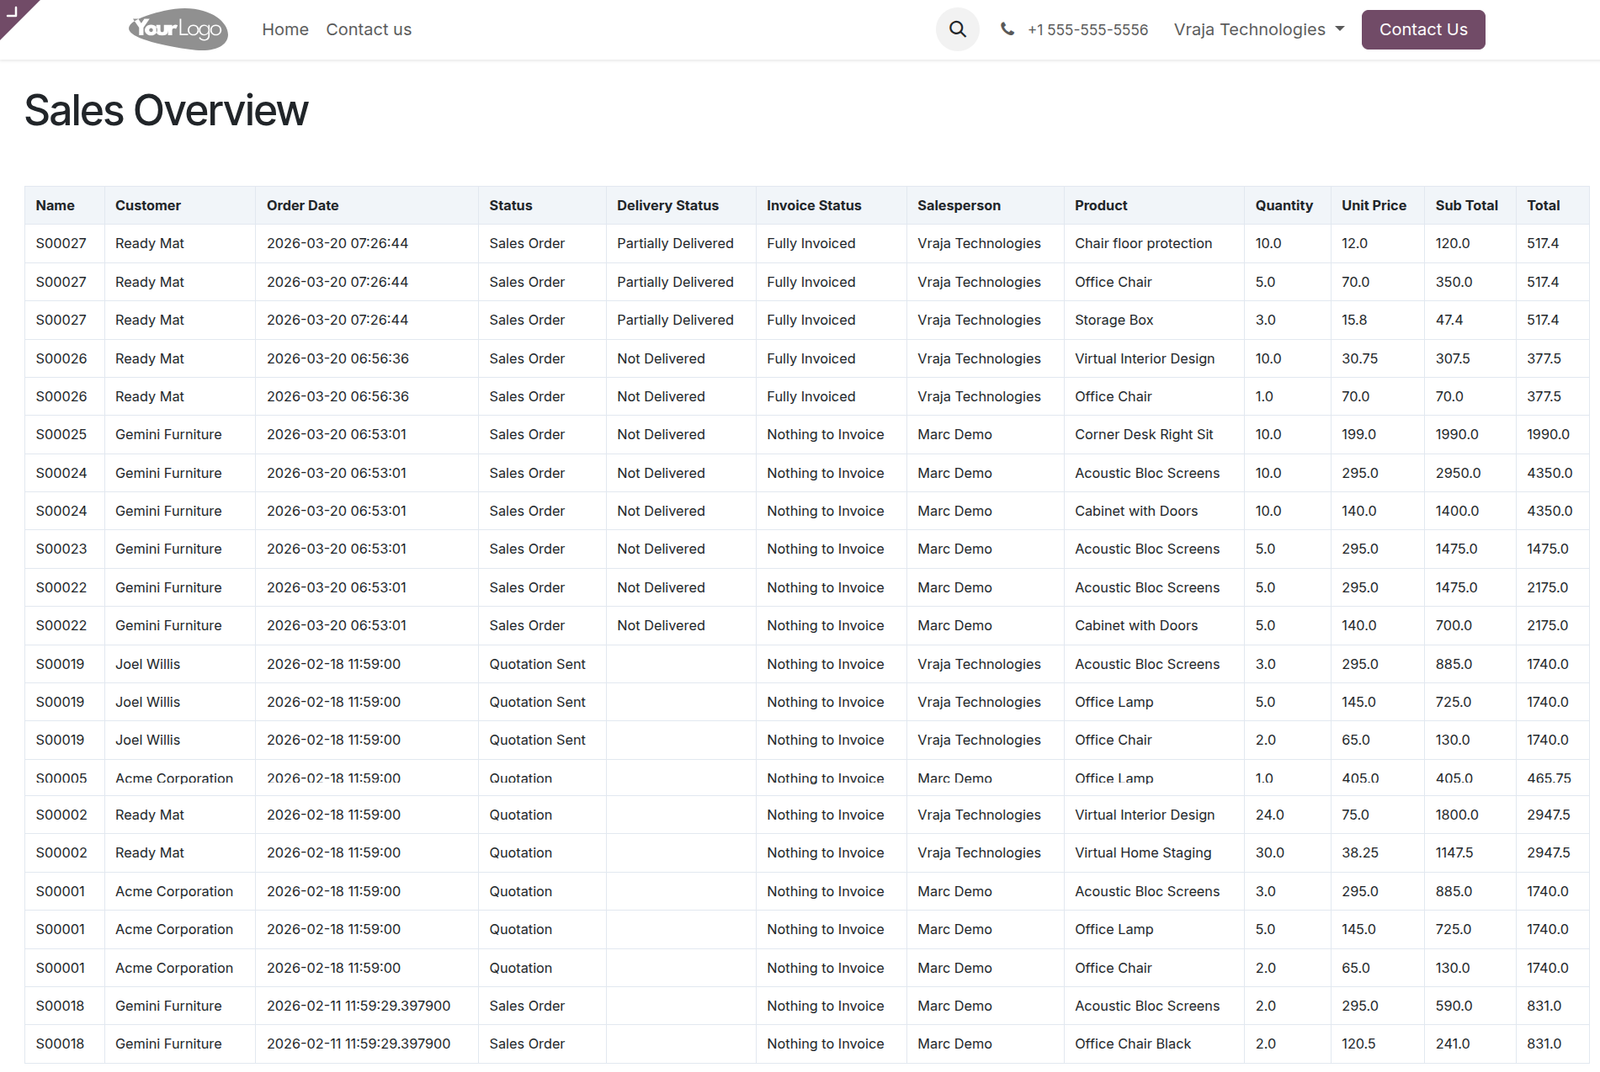
Click the Open Dashboard button to display the dashboard table, which will render data using the fields and configurations you have selected.
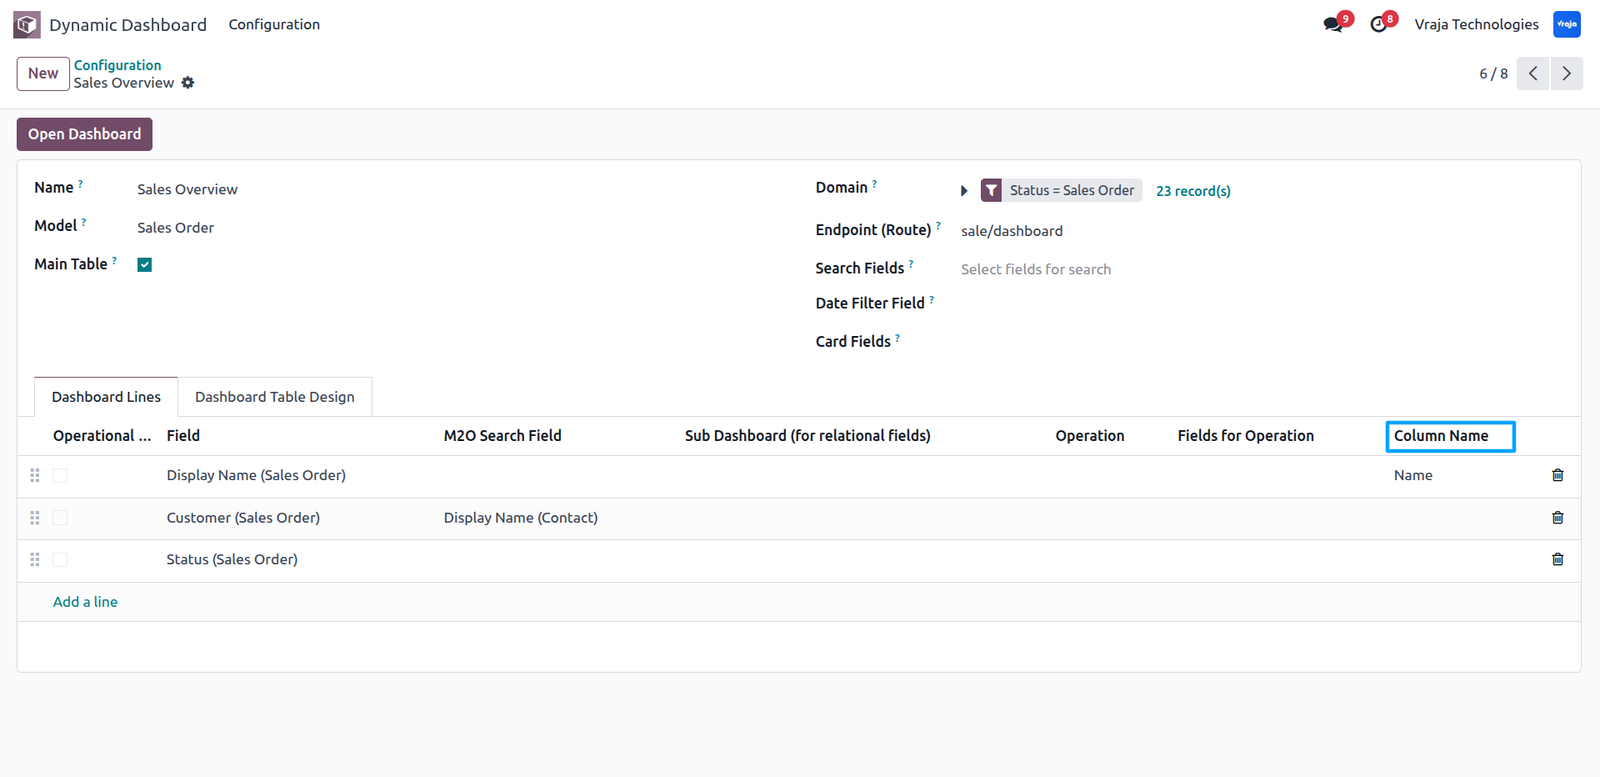
We can define custom column names for the dashboard table, allowing you to display fields with user-friendly or descriptive labels instead of the default field names.
In the Dashboard Lines, you can assign a sub-dashboard to relational fields, such as the Order Lines of a Sale Order. Sub-dashboards should be created without enabling the Main Table option, as they are considered secondary tables.
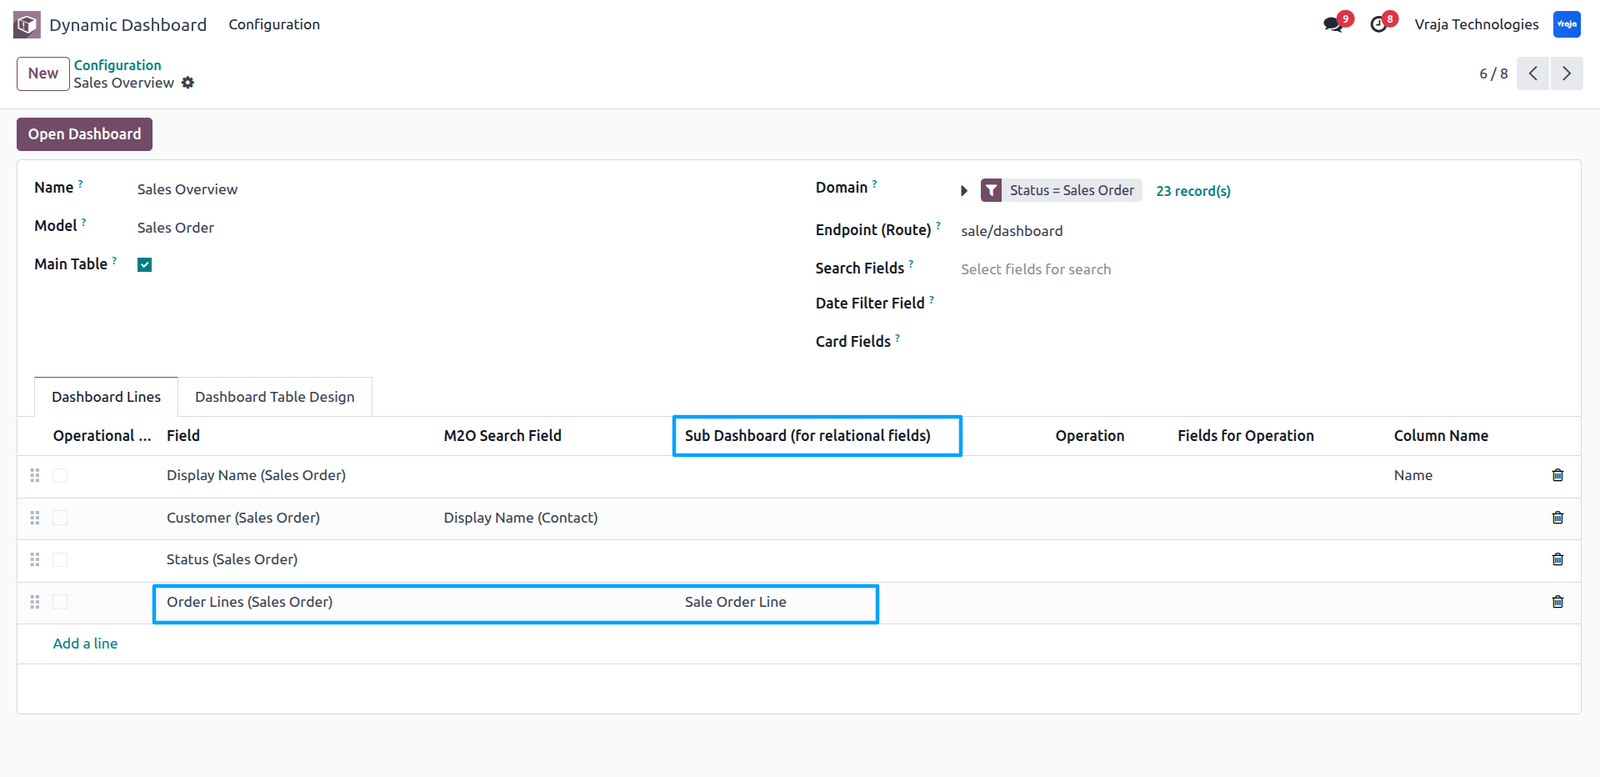
Once selected, configure the sub-dashboard to define which fields and data should be displayed for the related records in the dashboard.
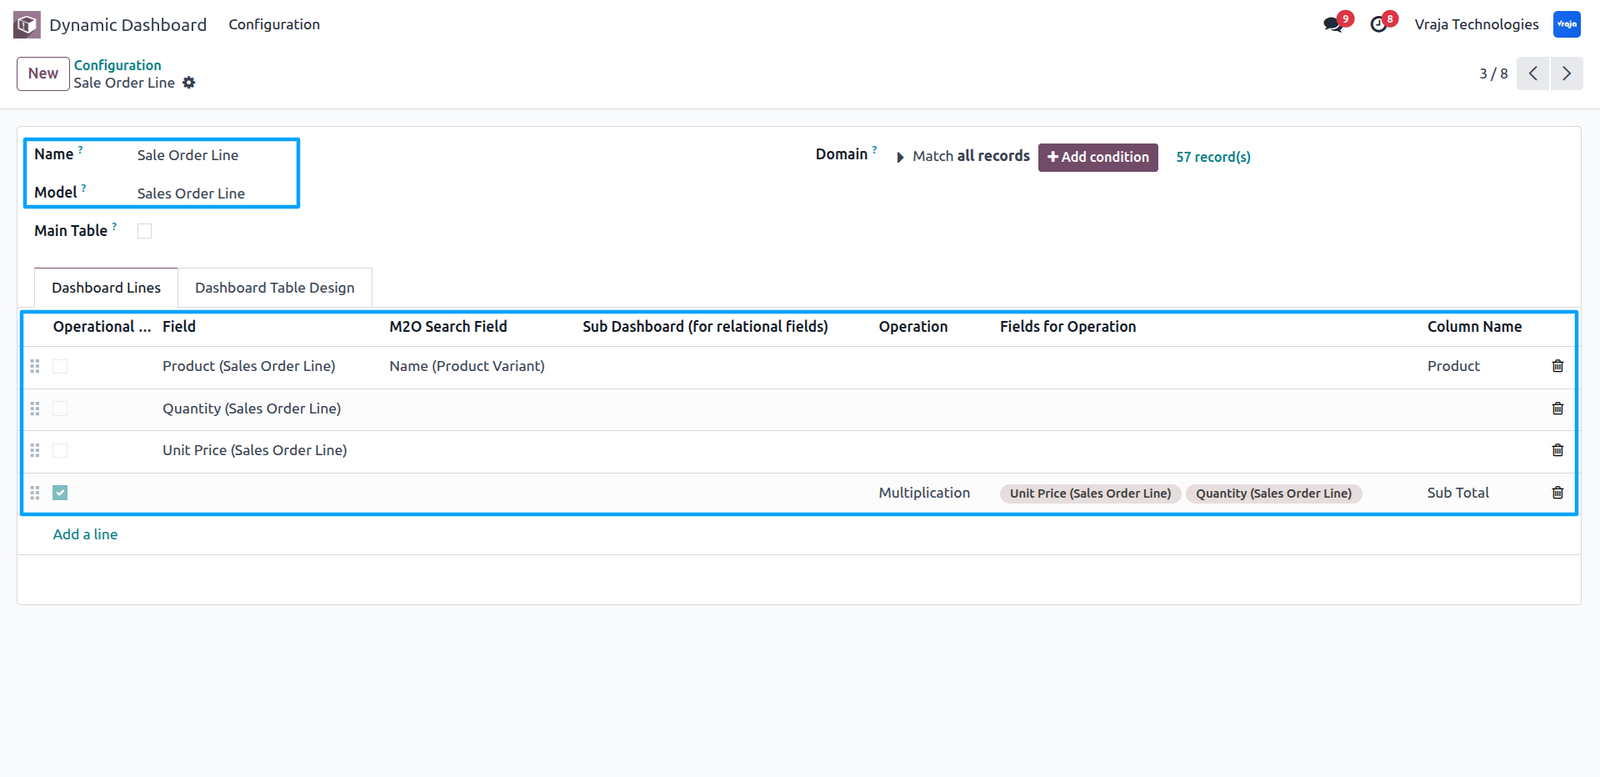
In the Dashboard Lines, you can enable the Operational Field option to create calculated columns. Once enabled, you can choose the operation type: Addition or Multiplication. Then, select the fields whose values will be used in the calculation, and define a custom column name to display the result on the dashboard table.
Clicking the Open Dashboard button redirects you to the configured website endpoint, where the dashboard table is displayed. This view includes all selected fields, relational sub-tables, and any operational (calculated) fields you have configured.
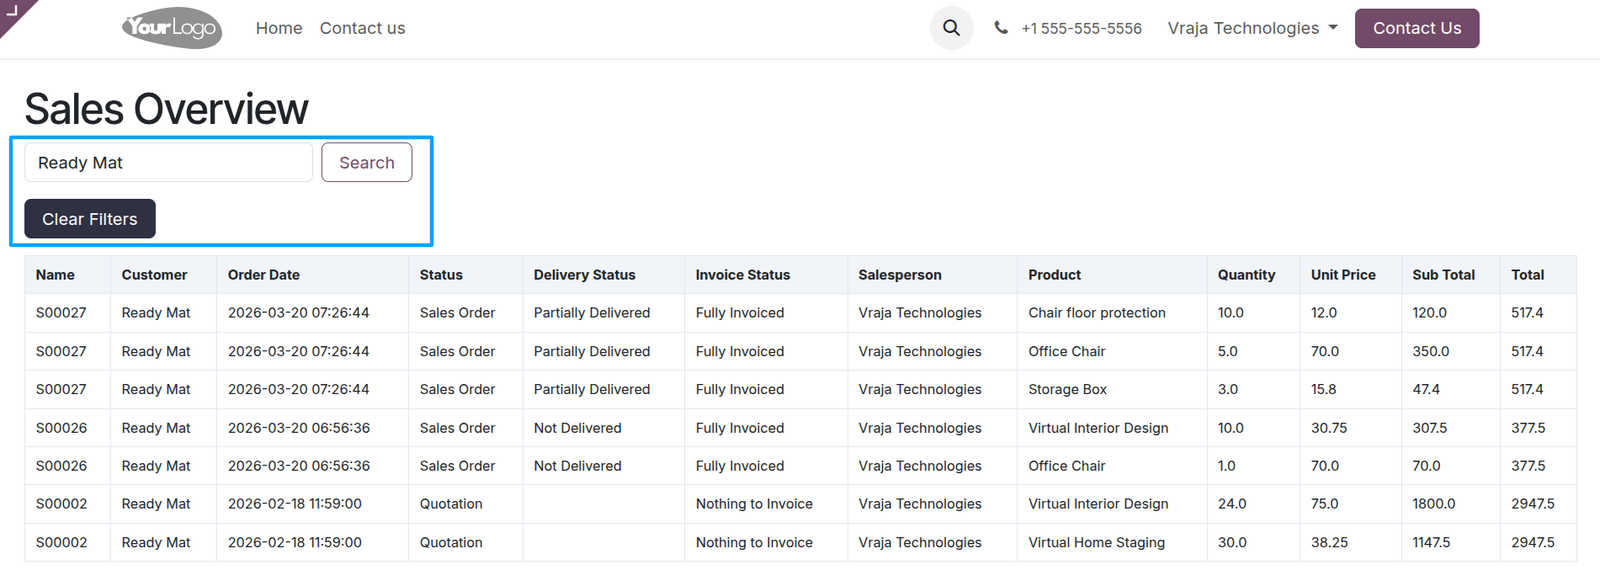
Within the dashboard configuration, you can define dynamic search filters by selecting multiple fields to search across. The dashboard dynamically filters and displays records based on the applied search conditions.
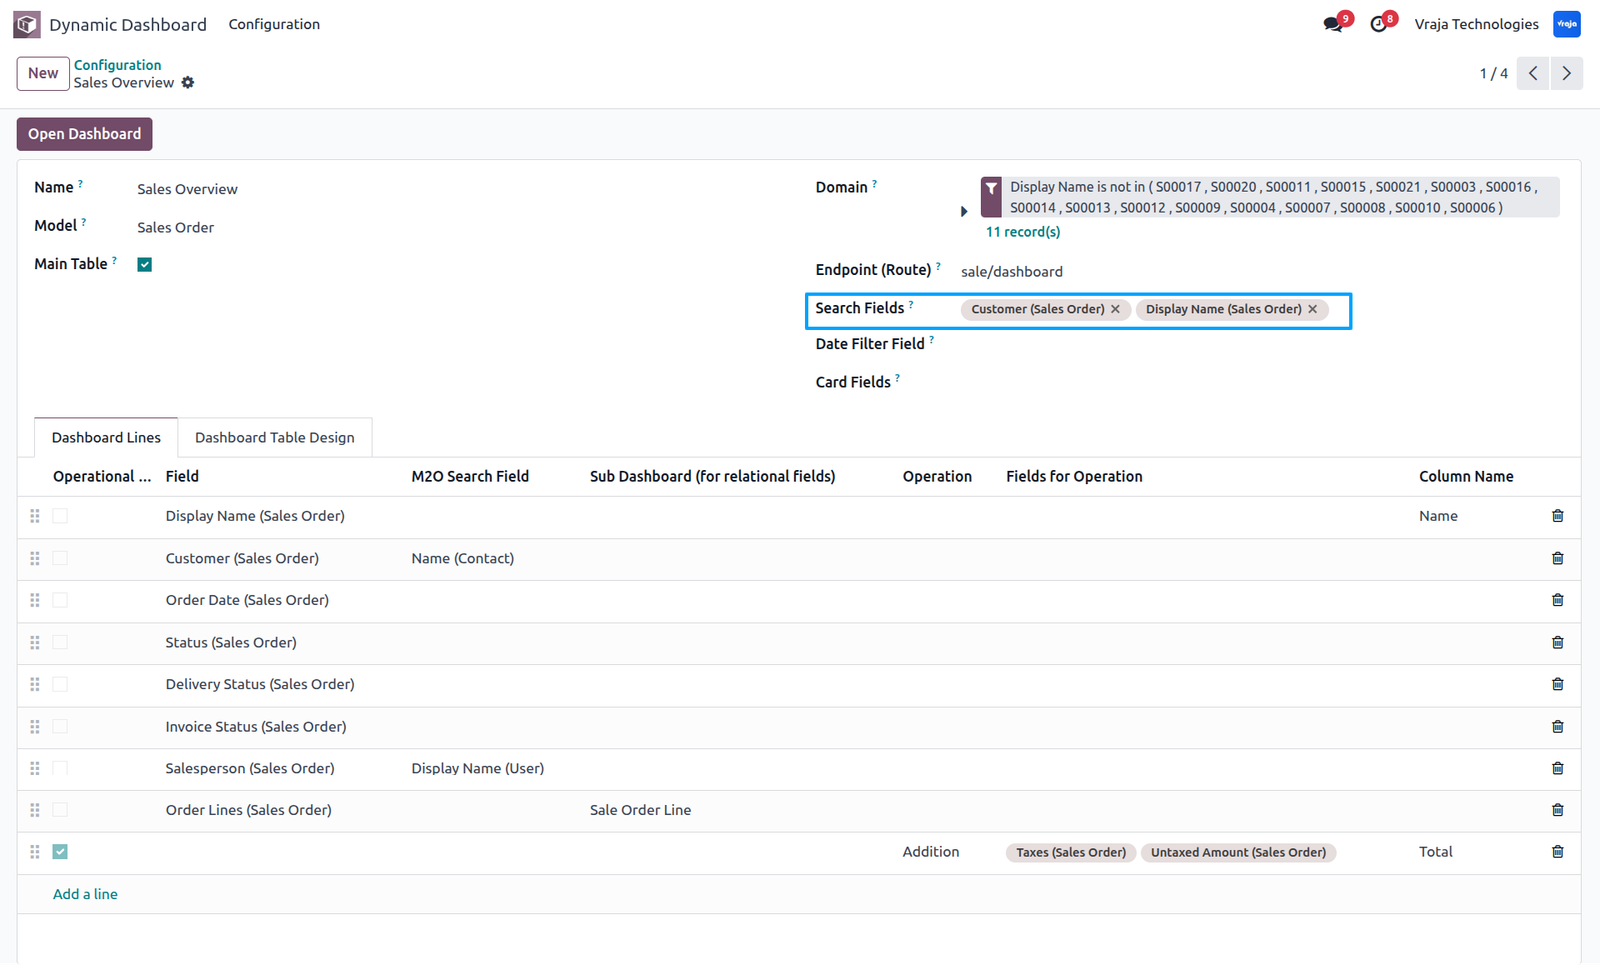
In this scenario, the customer name is applied as a filter to retrieve records associated with a specific customer. Additionally, a Clear Filter option is provided to remove the applied filters and restore the full dataset view.
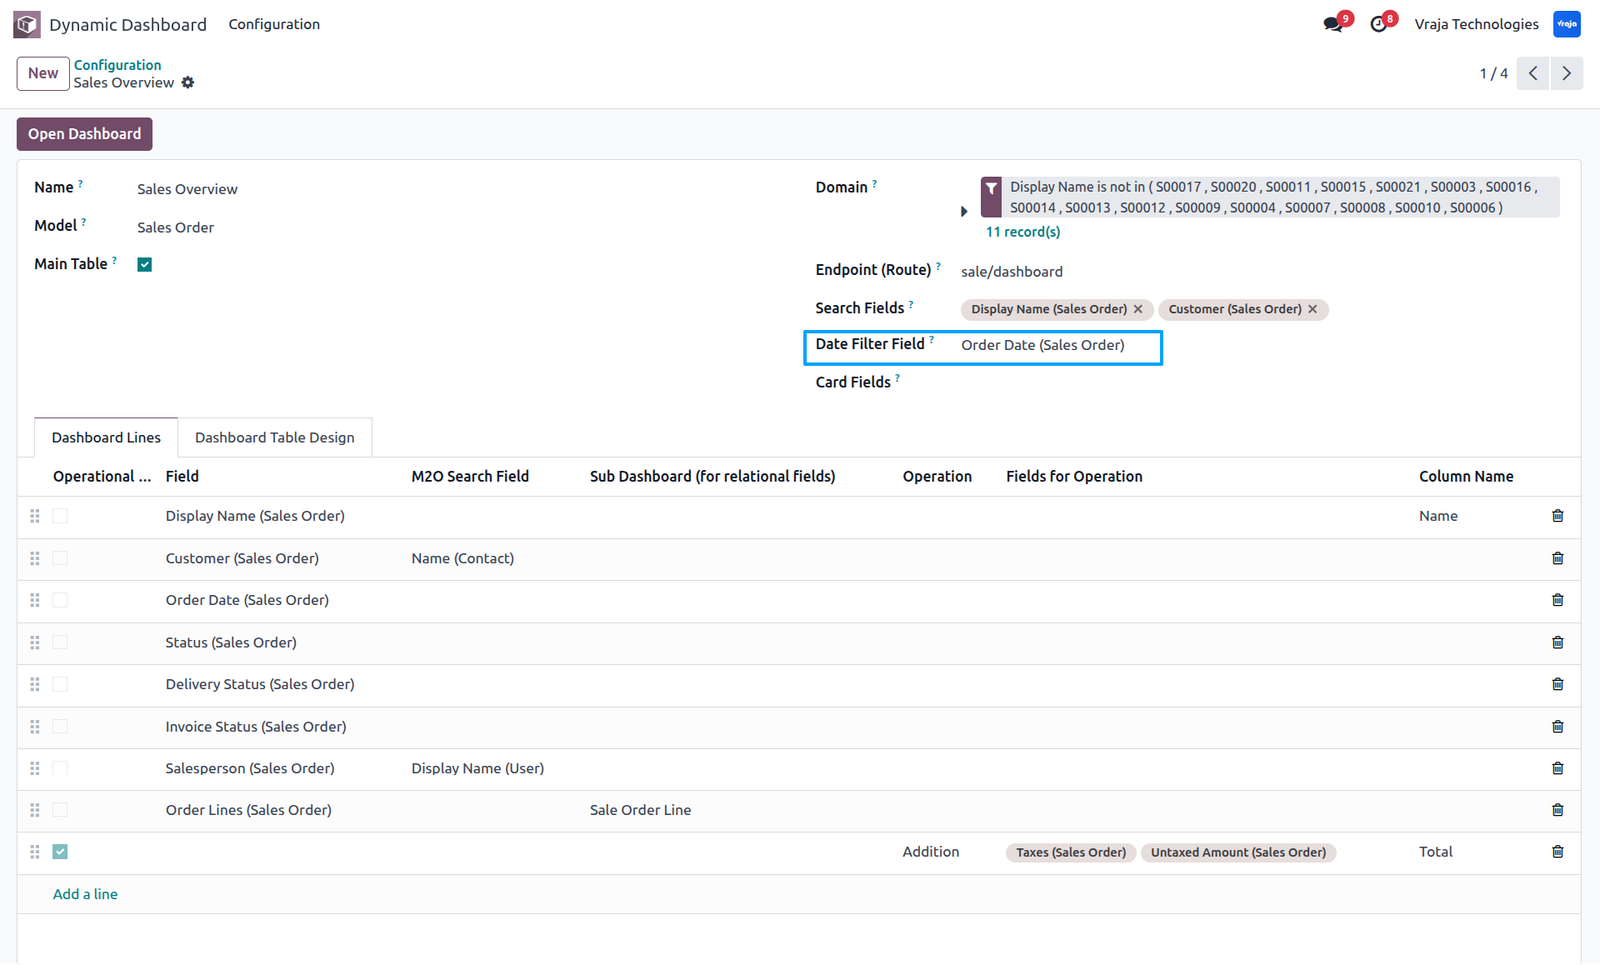
In the dashboard configuration, a date filter field is available, allowing users to select any date or datetime field to filter records within a specific range (from–to).
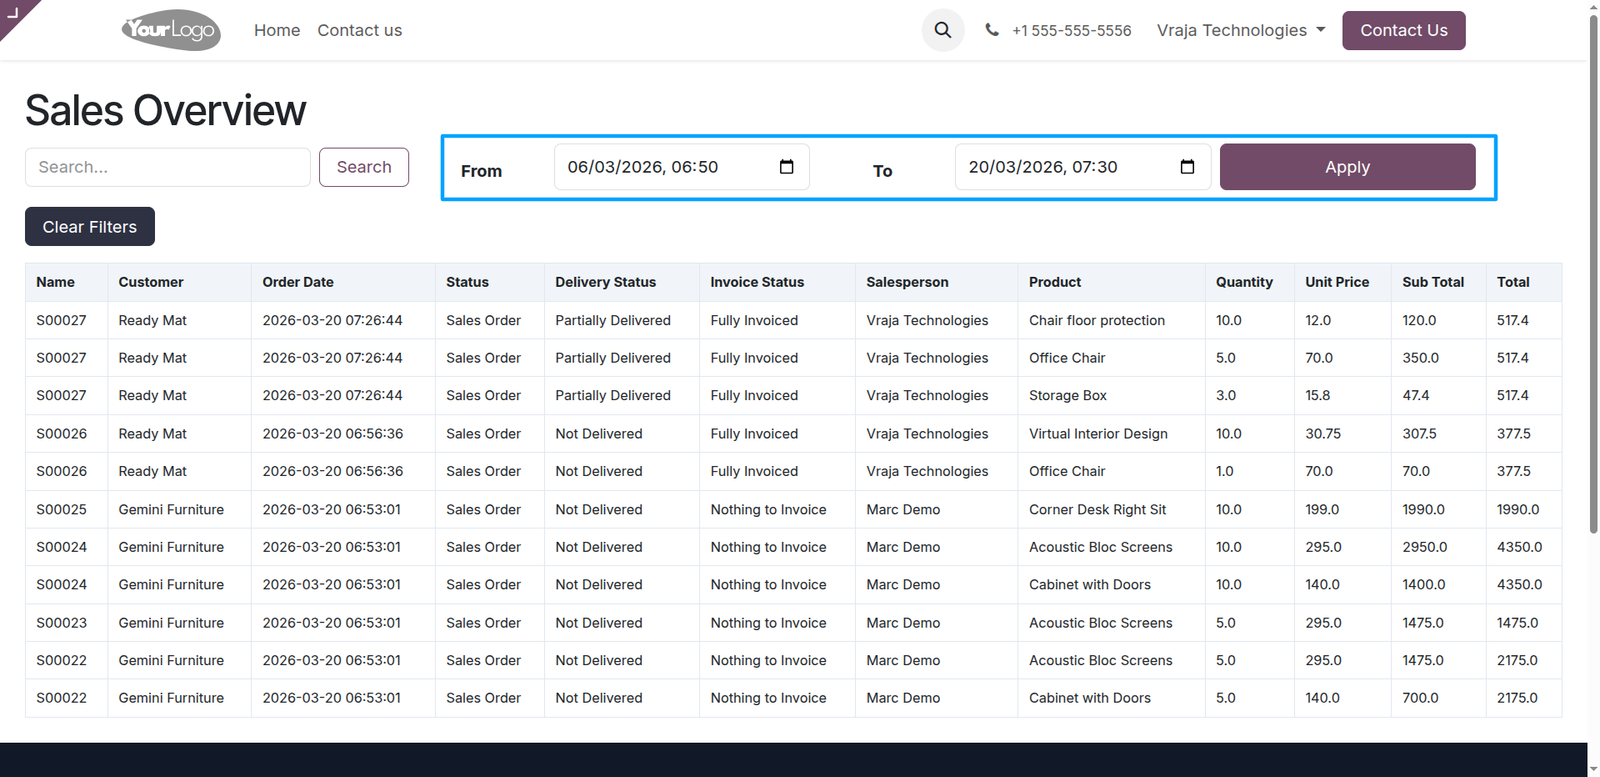
The dashboard allows you to filter records within a specified date range (from–to) using either date or datetime fields.
In the configuration, you can define card fields to highlight key information, enhancing the dashboard’s visual appeal. Multiple cards can be configured and displayed simultaneously on the dashboard.
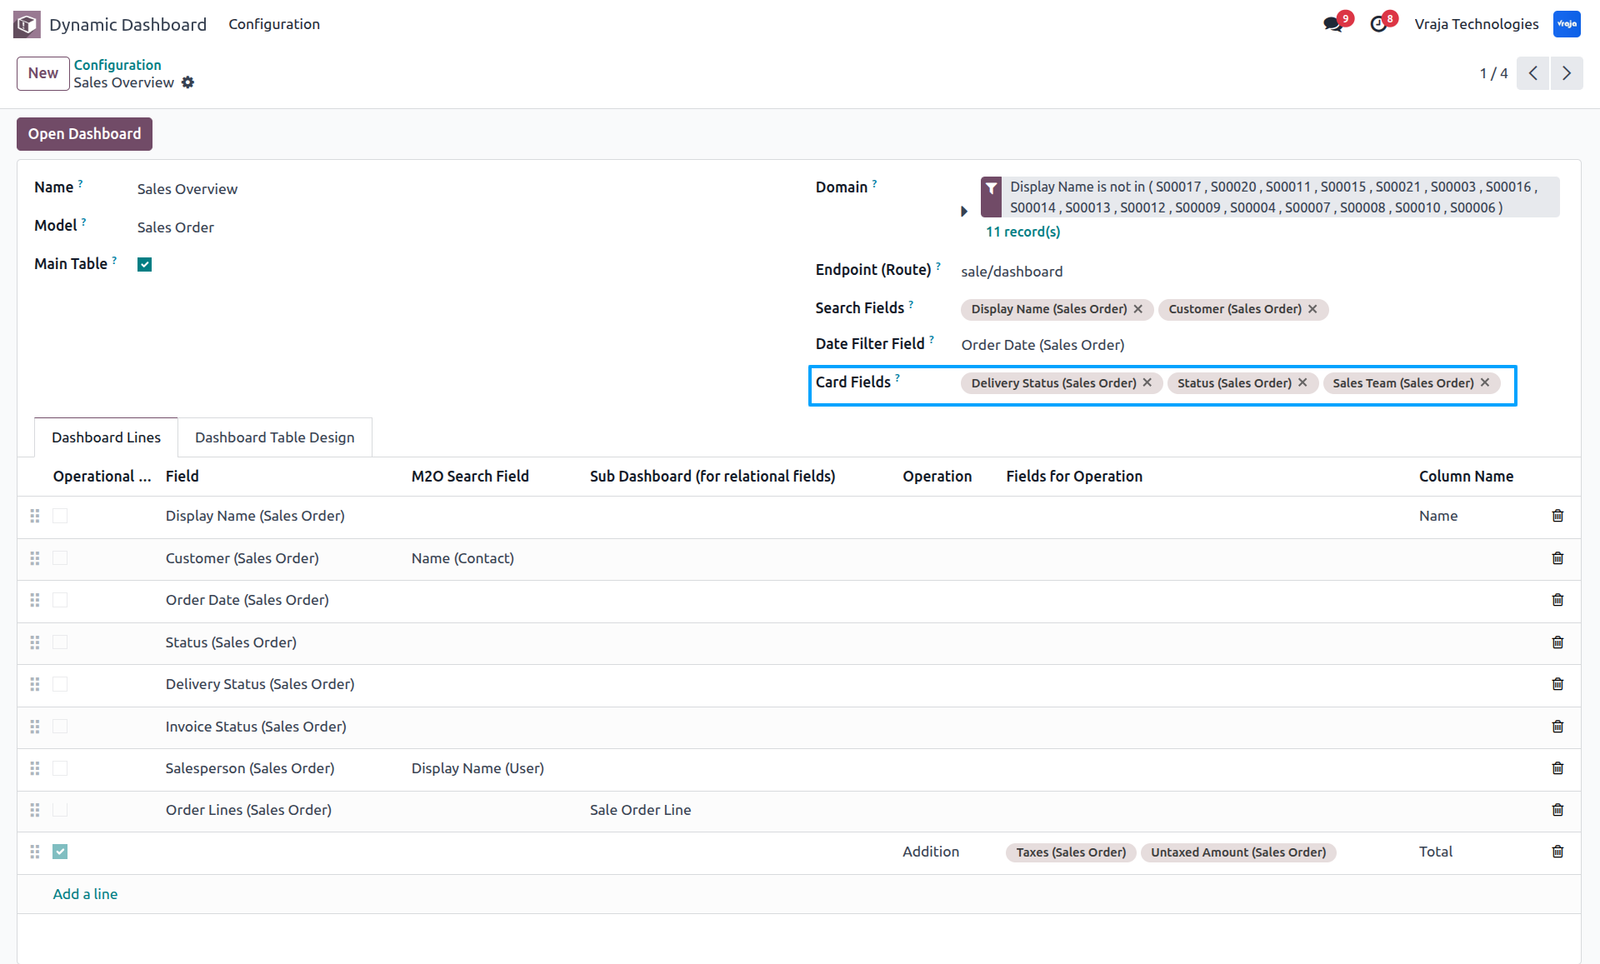
Each card dynamically displays the count of records for the selected field.
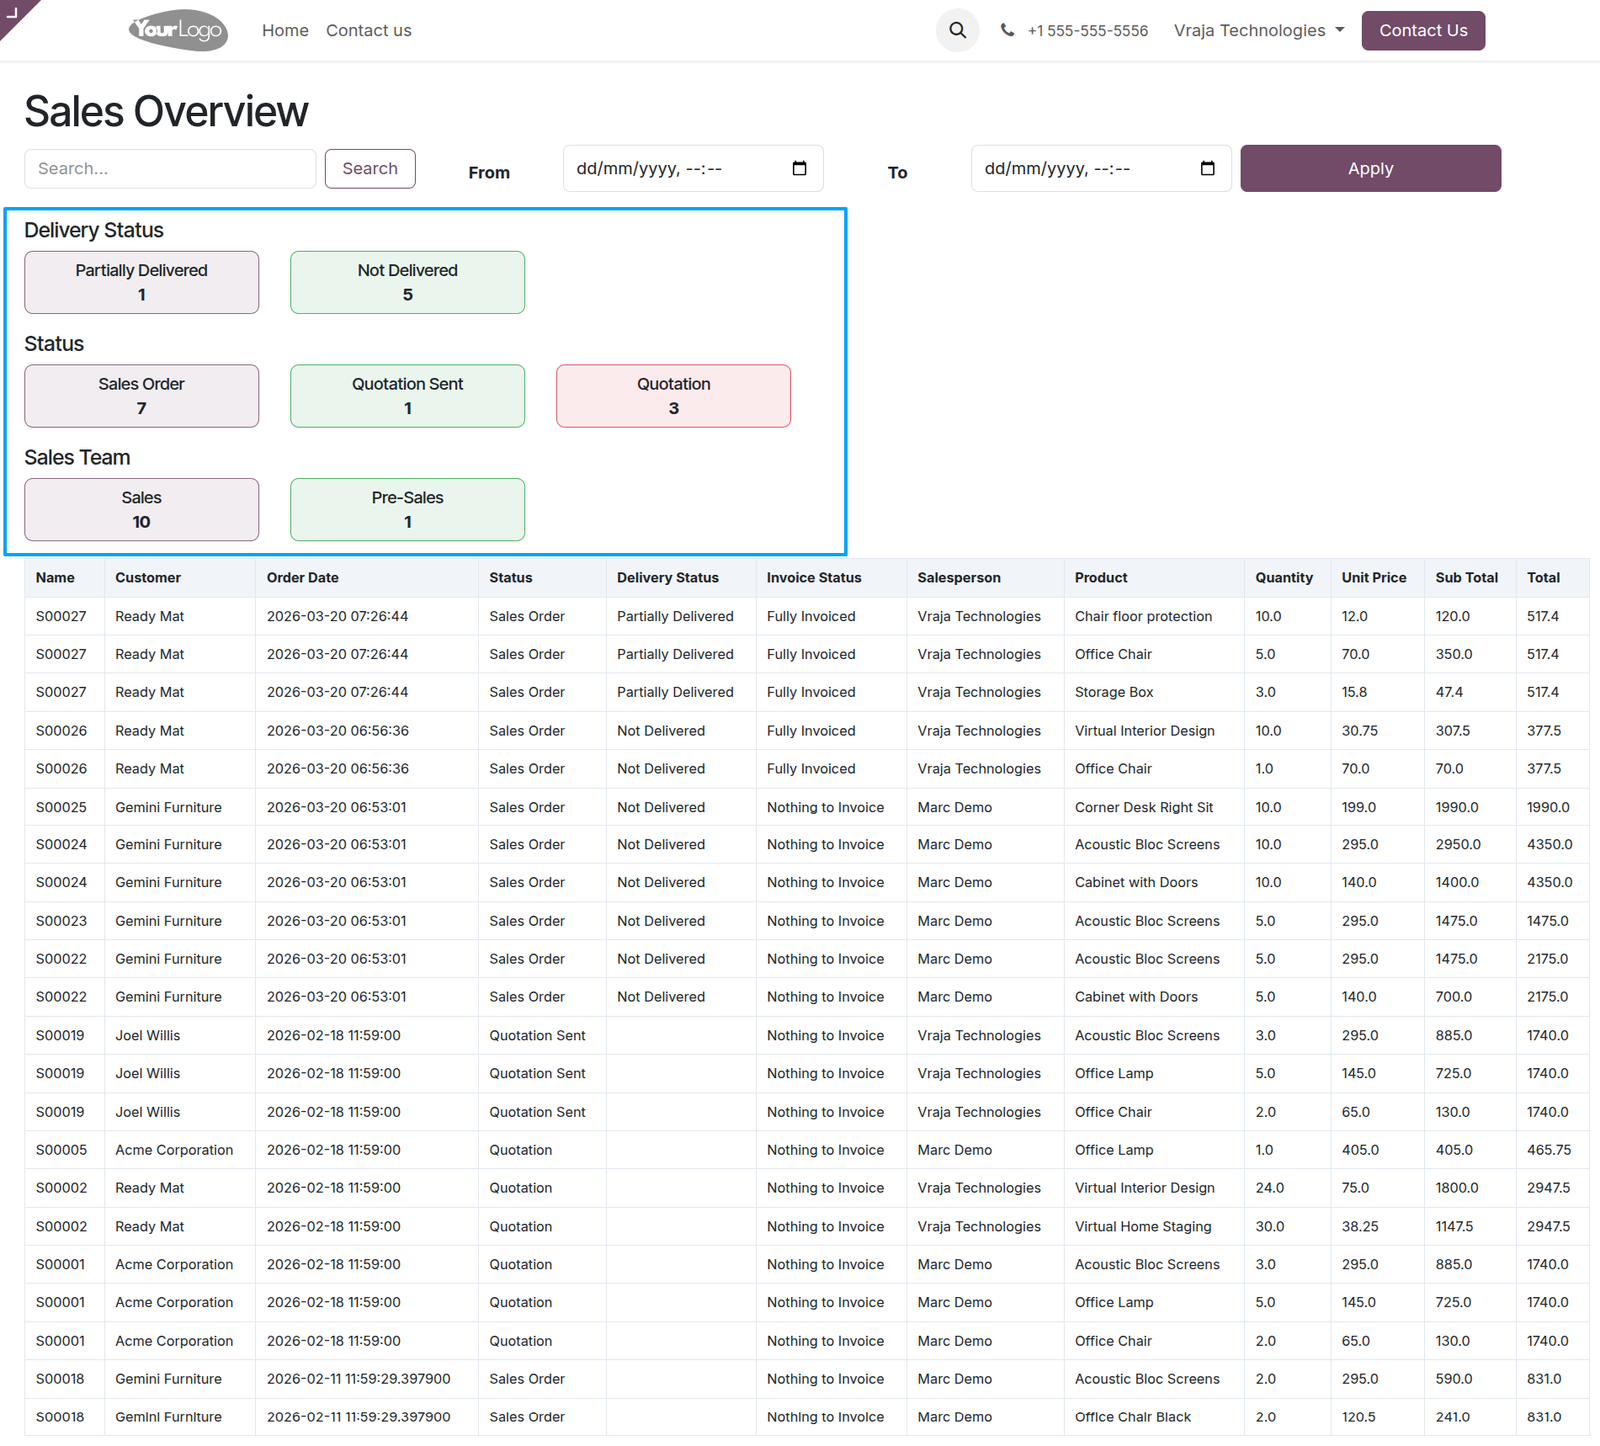
In the dashboard configuration, you can define Card Days to display summary cards based on predefined time periods. These cards calculate and show record counts using the selected Date Filter Field.
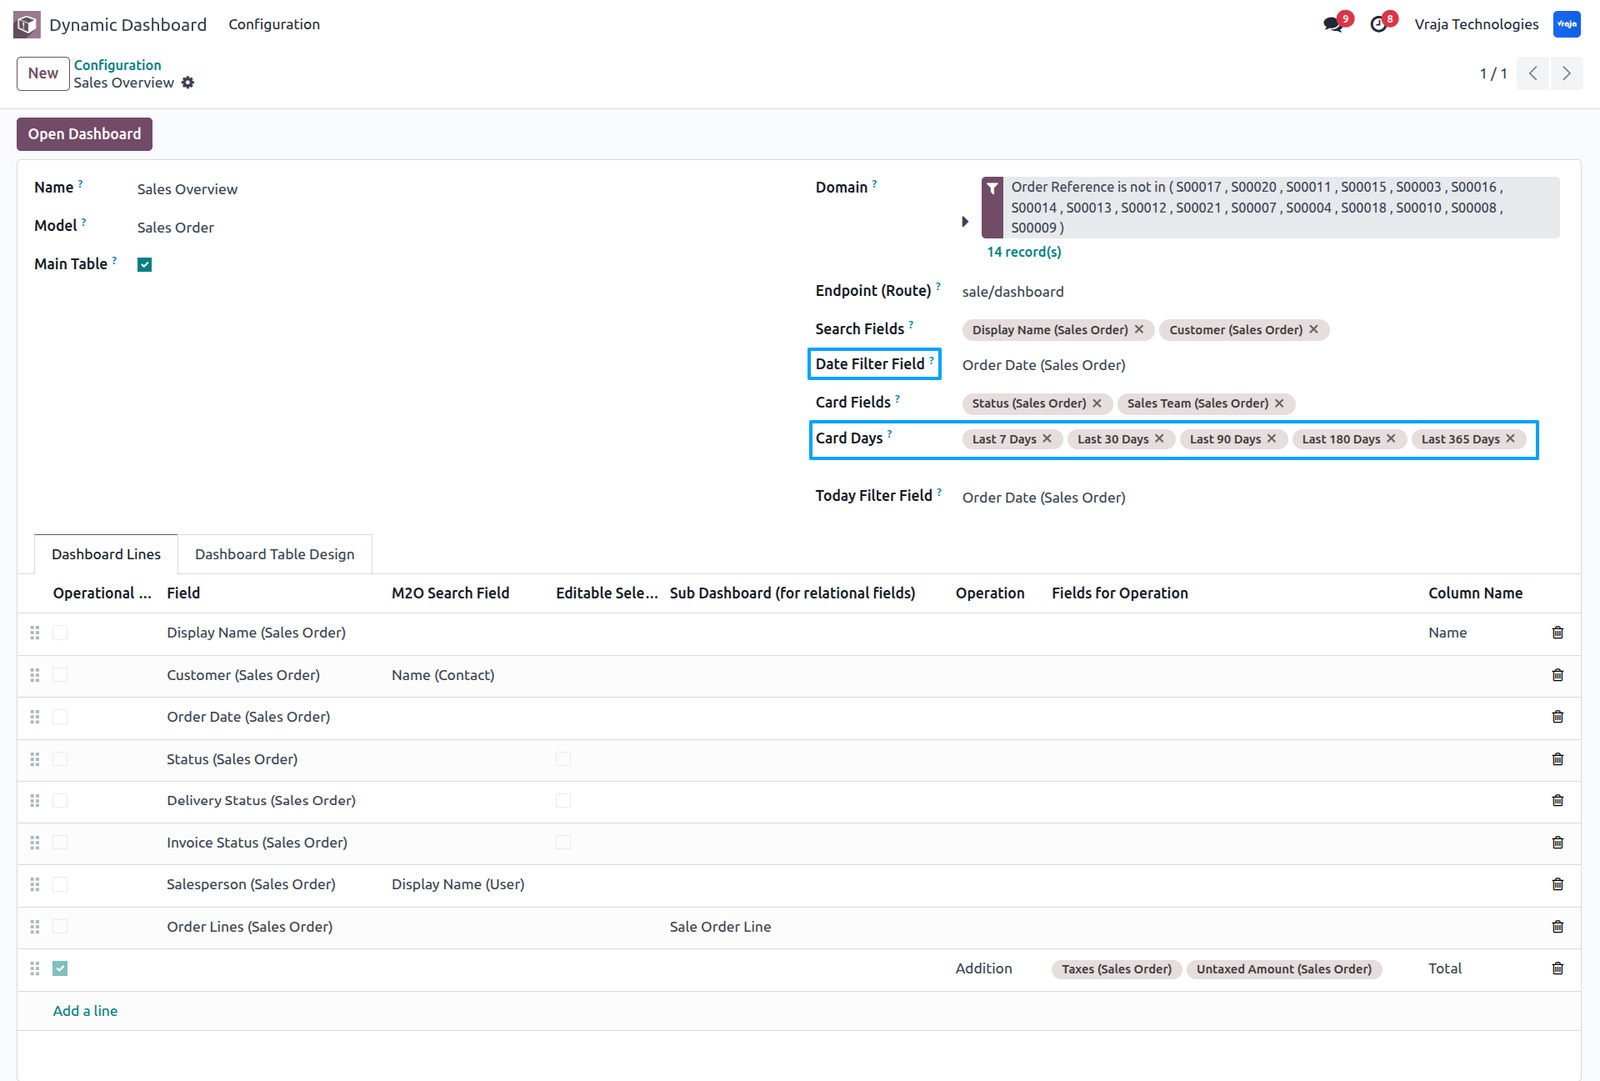
Each option represents a previous day range such as Last 7 Days, Last 30 Days, Last 90 Days, and automatically displays the number of matching records on the dashboard.
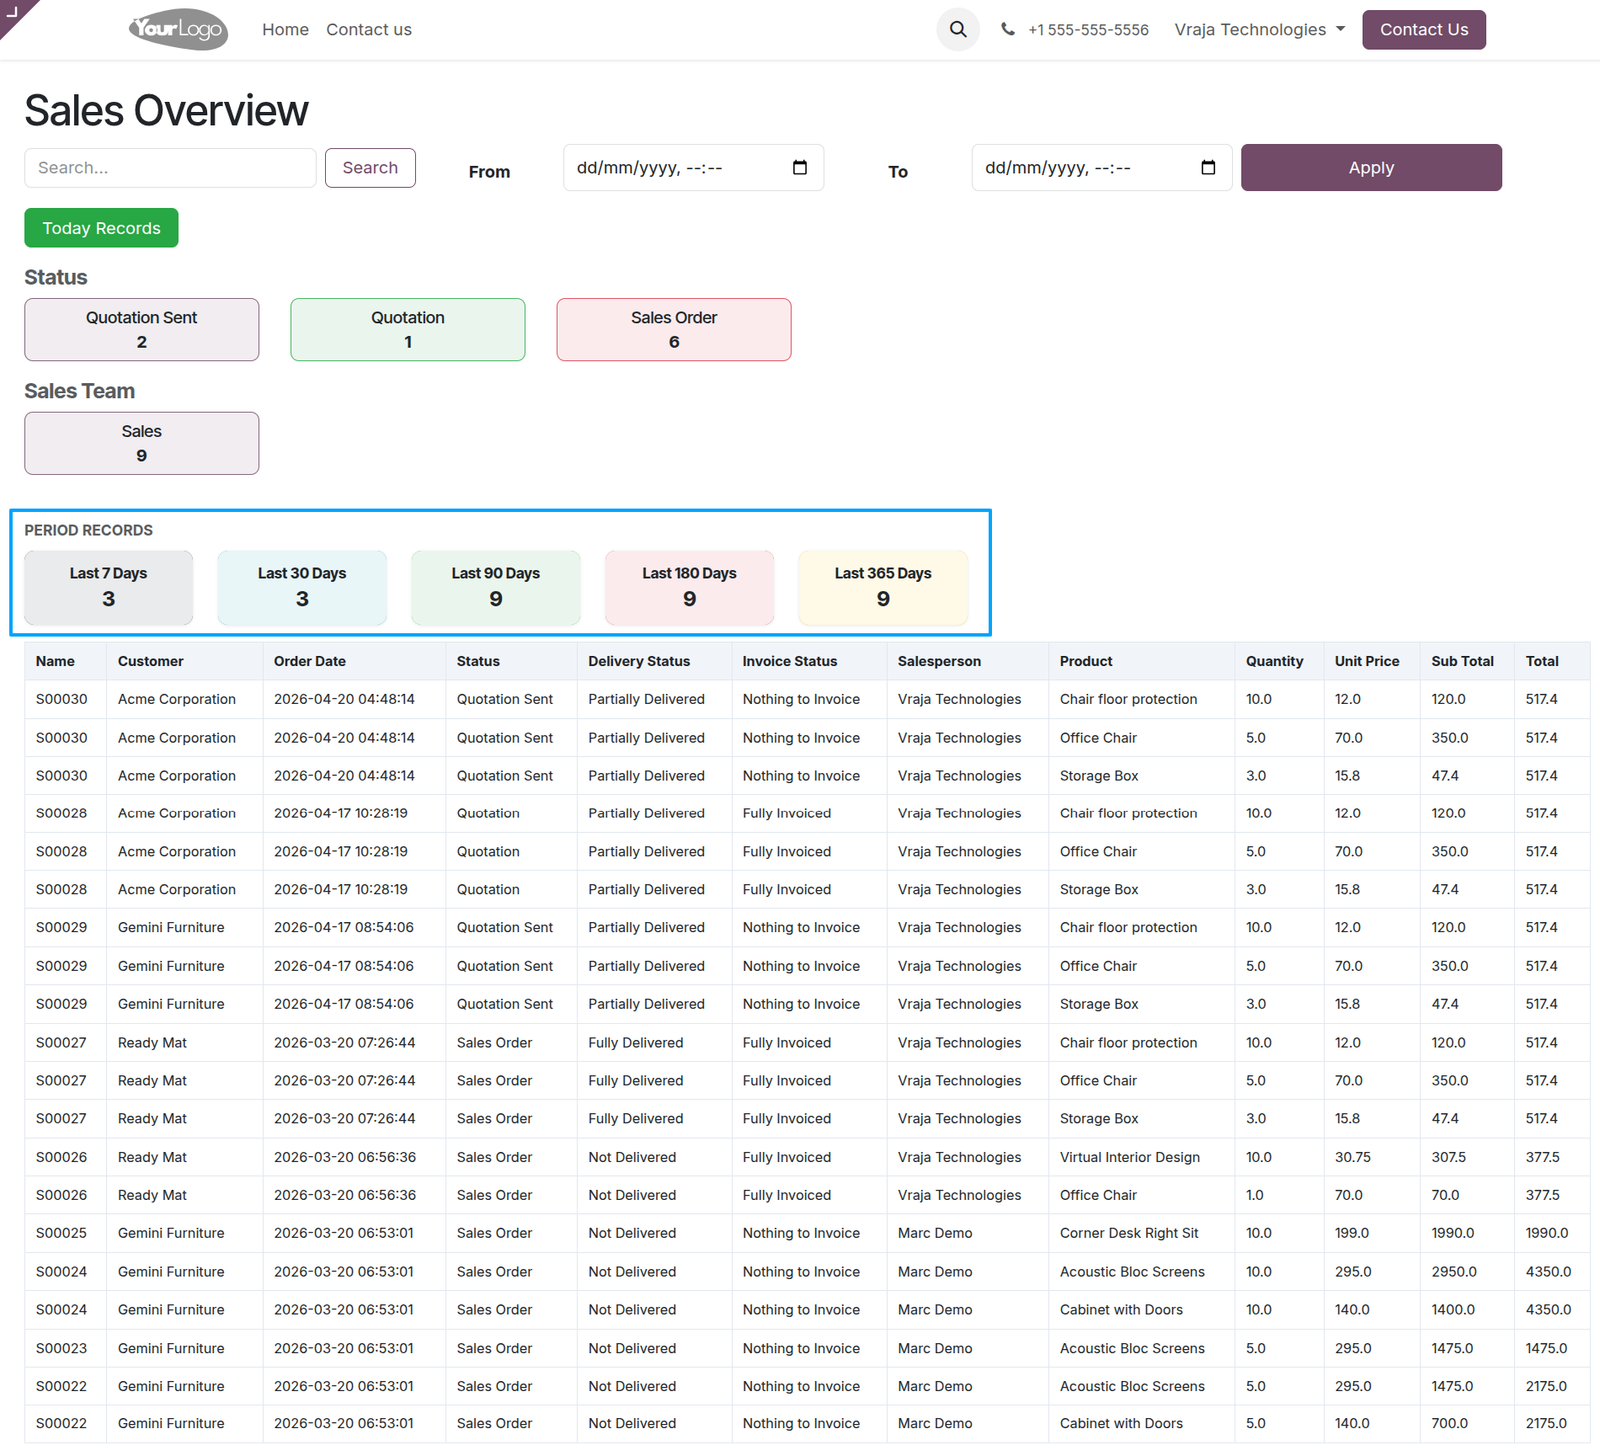
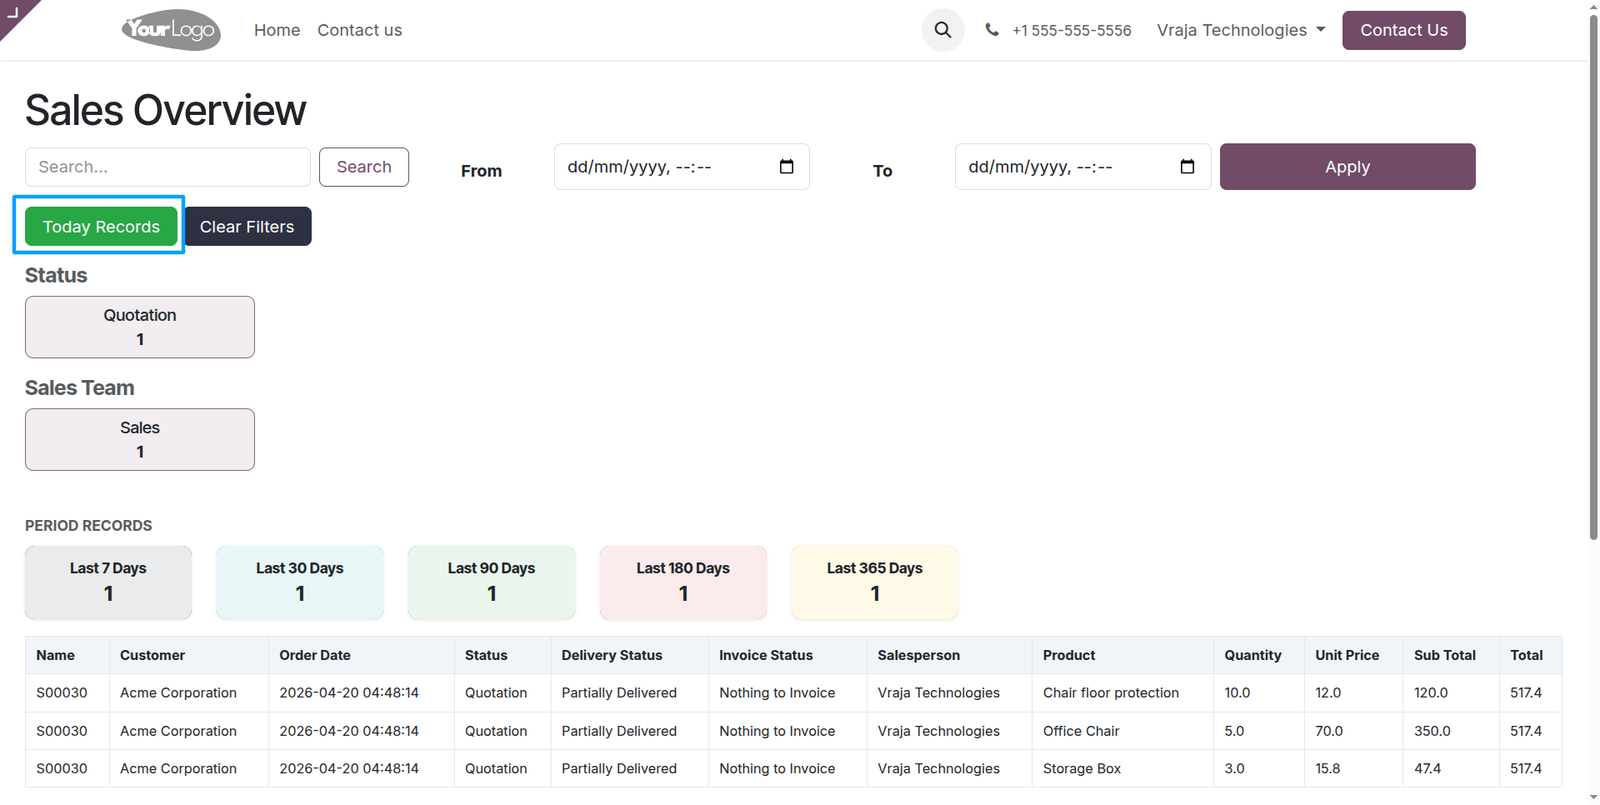
you can enable the Today Records option to quickly identify records created or updated today based on the selected Today Filter Field.
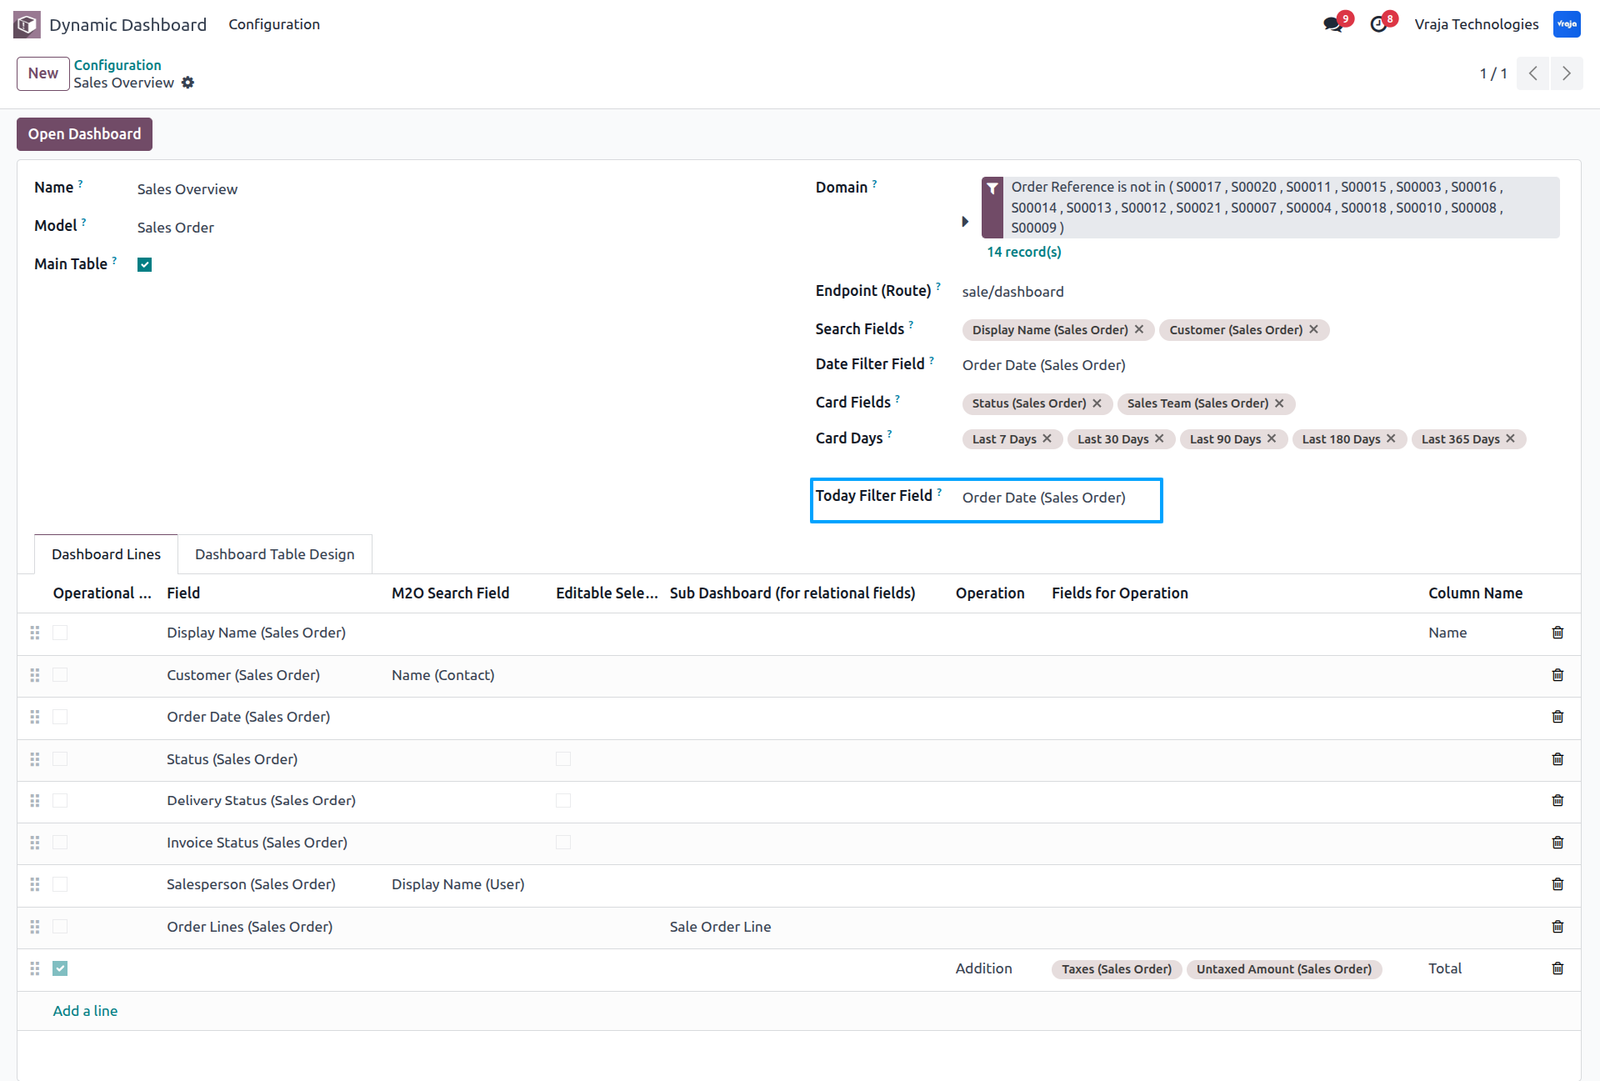
When you select a field in the Today Filter Field configuration and click the Today Records button on the dashboard, the system automatically filters and displays records for the current day based on the selected field.
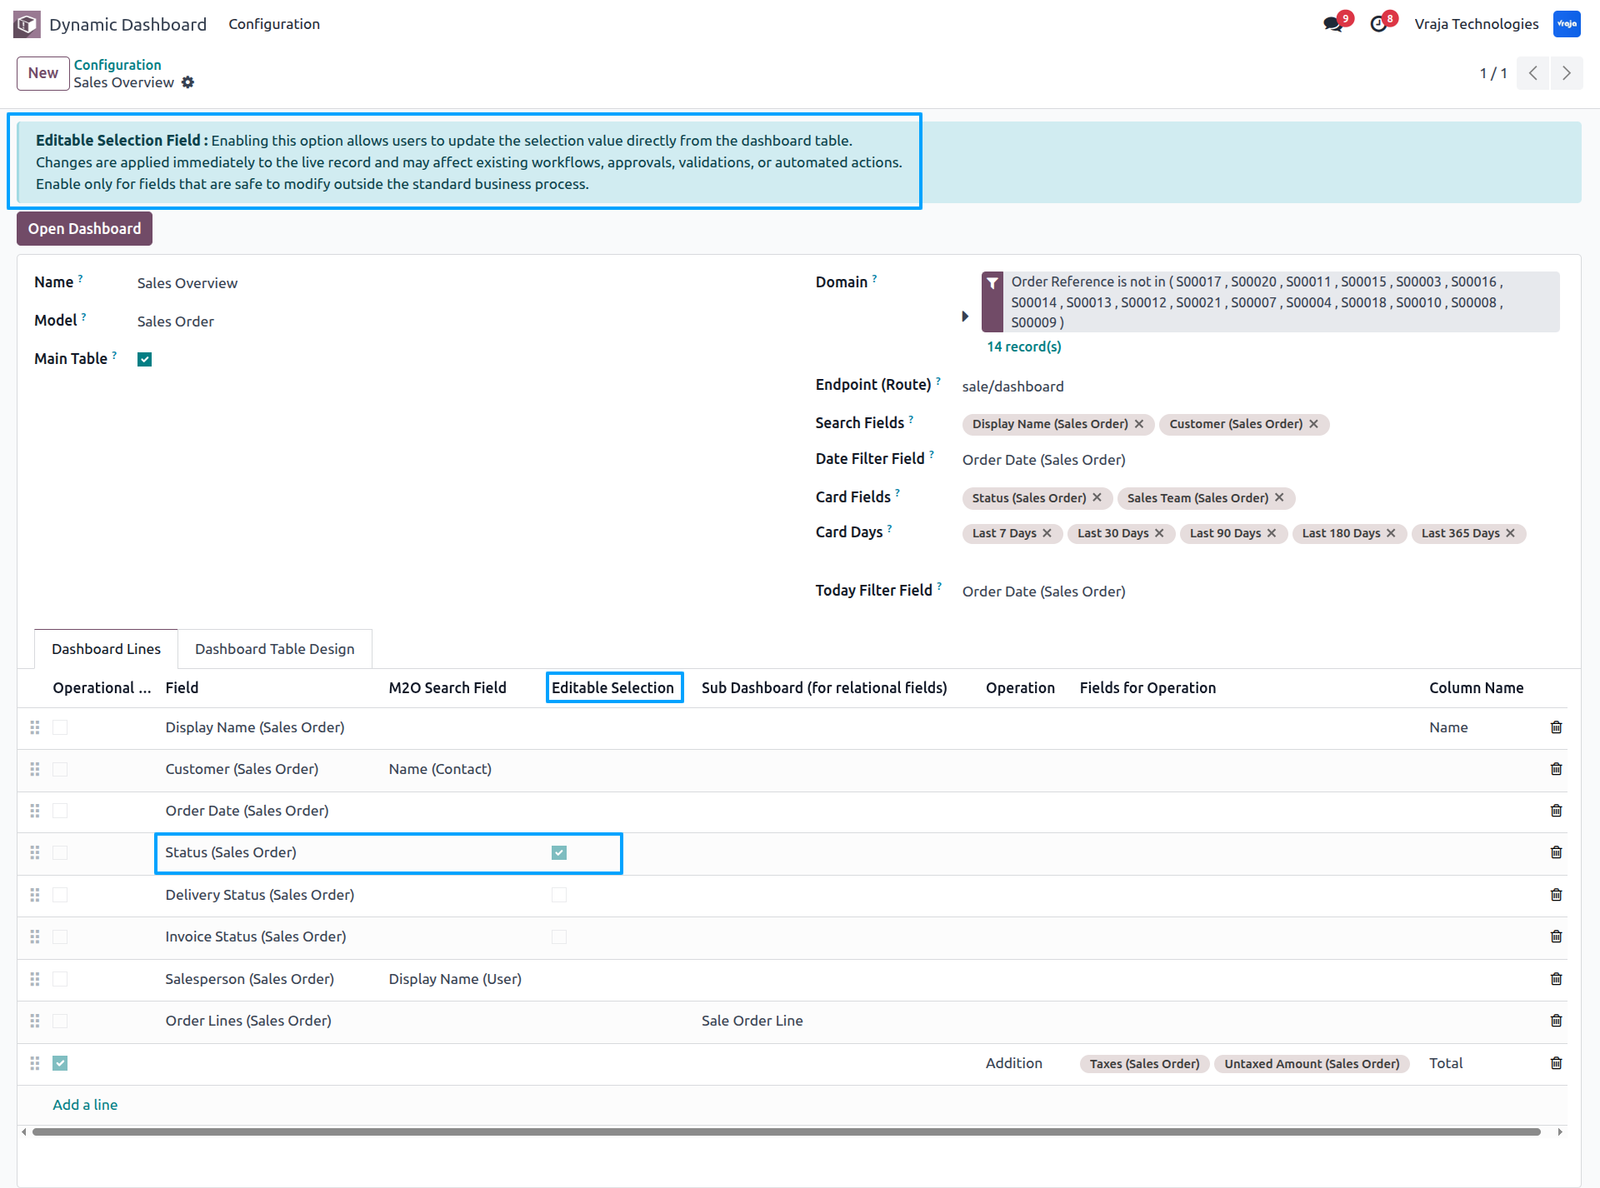
In the dashboard configuration, you can enable Selection Field Editing to update selection-type field values directly from the dashboard in real time.
This option is available within the Dashboard Lines configuration, where only selection fields can be made editable. Once enabled, users can update specific record values instantly without navigating away from the dashboard.
This option is available within the To ensure data integrity, the system displays a warning message when this feature is activated, as real-time updates can directly impact business processes. This helps users make informed decisions while modifying important data.
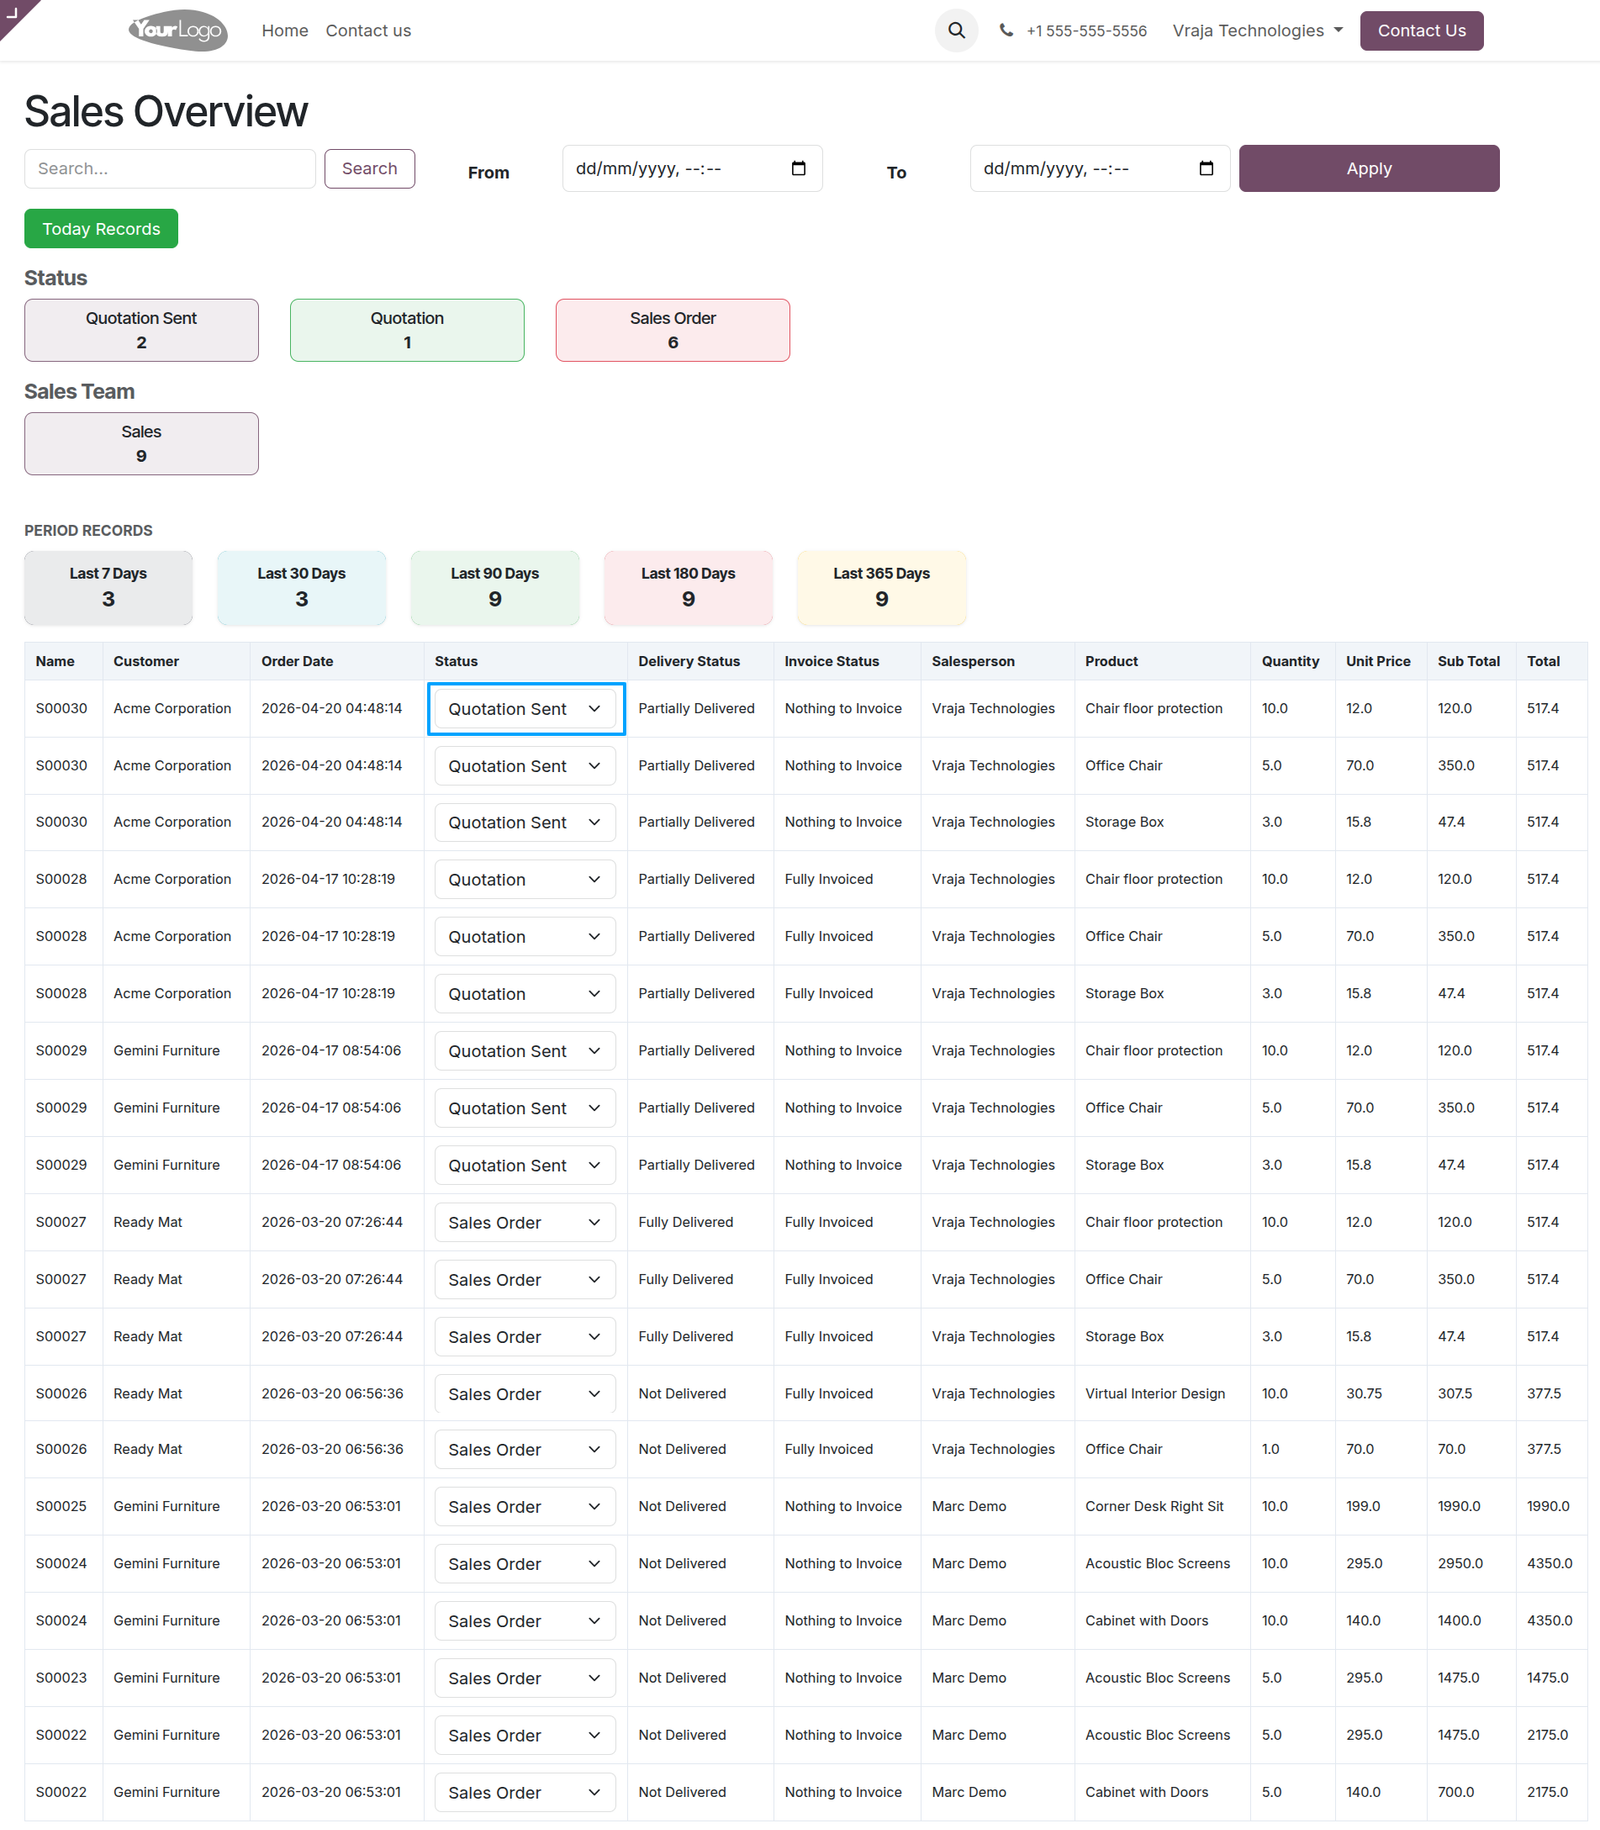
When Selection Editable is enabled, the dashboard displays selection fields in editable mode, allowing users to directly change the selection value from the dashboard, and the system instantly updates the selected value for the specific record in real time.
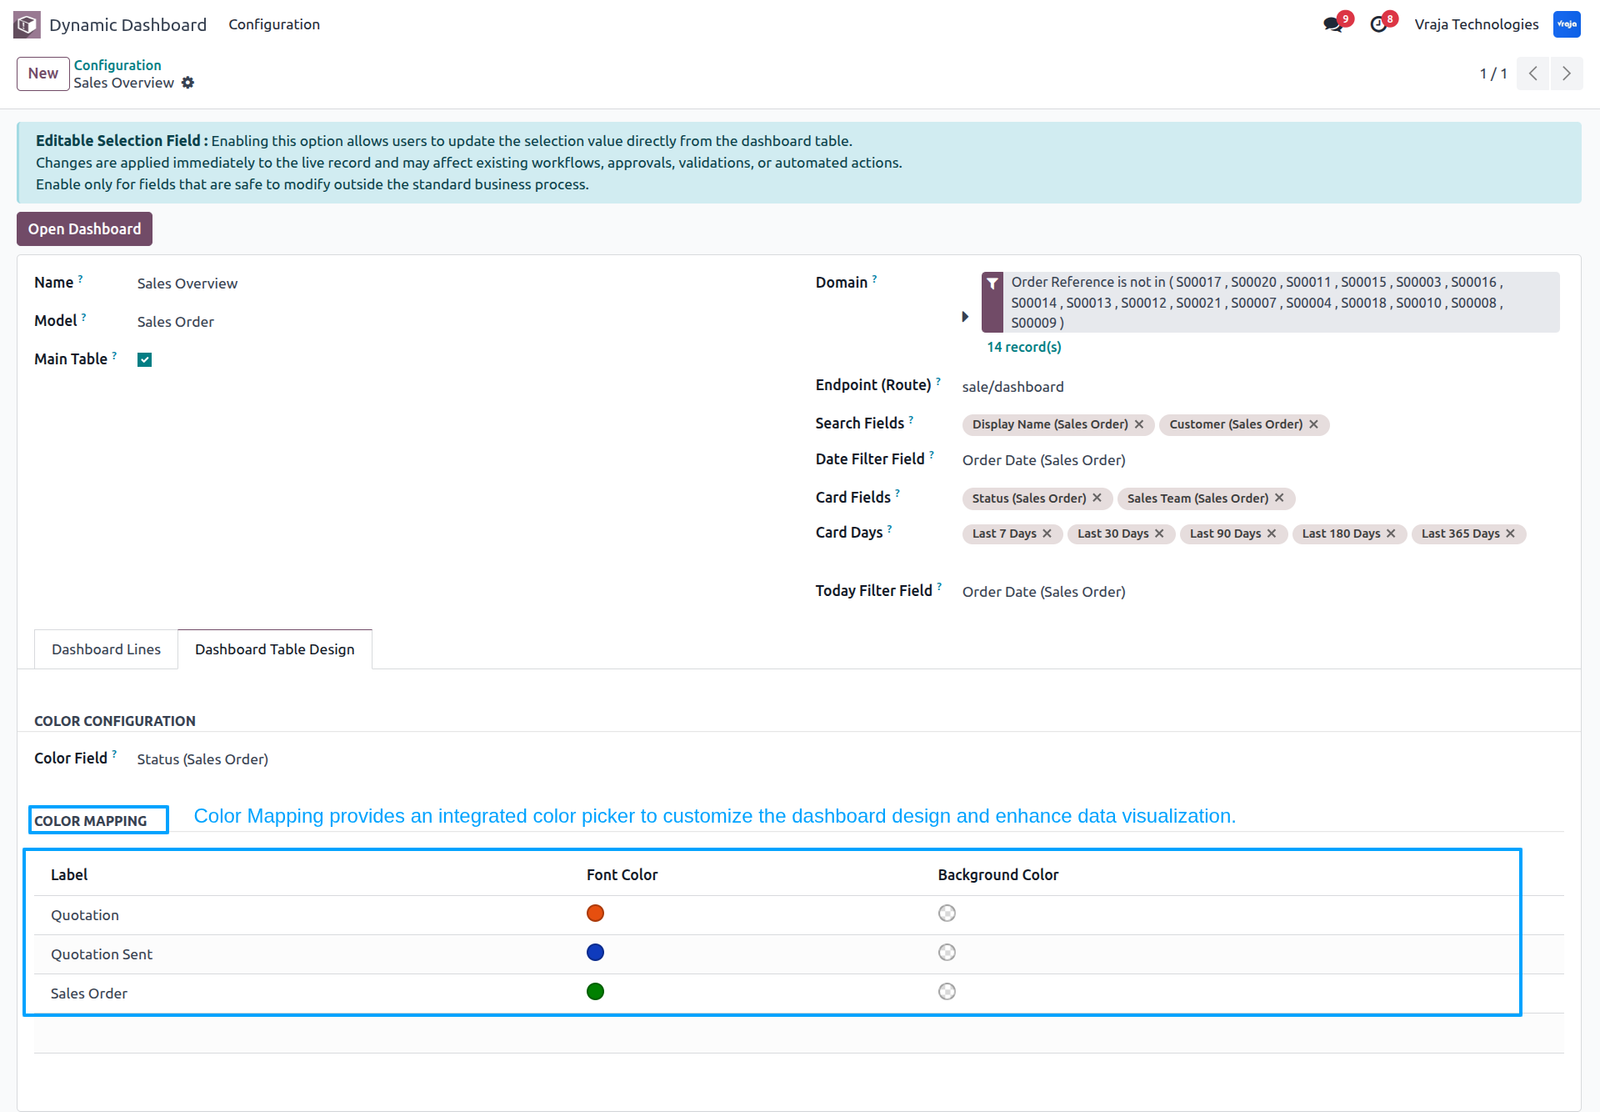
In the dashboard configuration, a Table Design tab is available, allowing you to customize the appearance of the dashboard table. You can select a color field, based on which the table records will be visually styled.
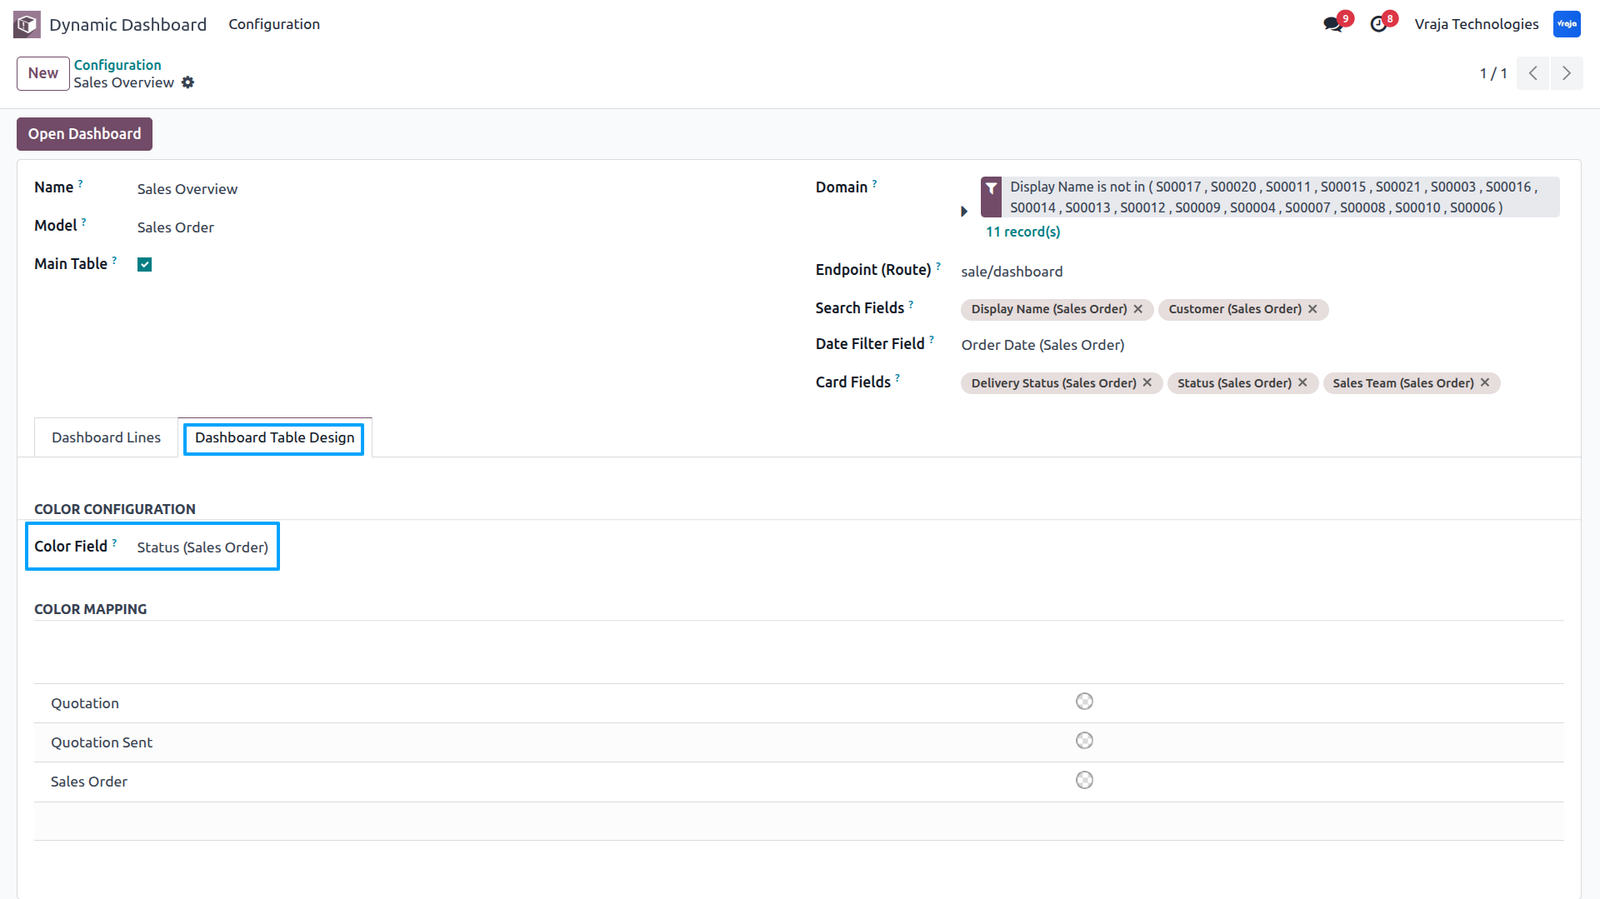
Once a color field is selected, its values are automatically populated in the Color Mapping section. Here, users can choose any color using the integrated color picker and assign specific colors to each field value.
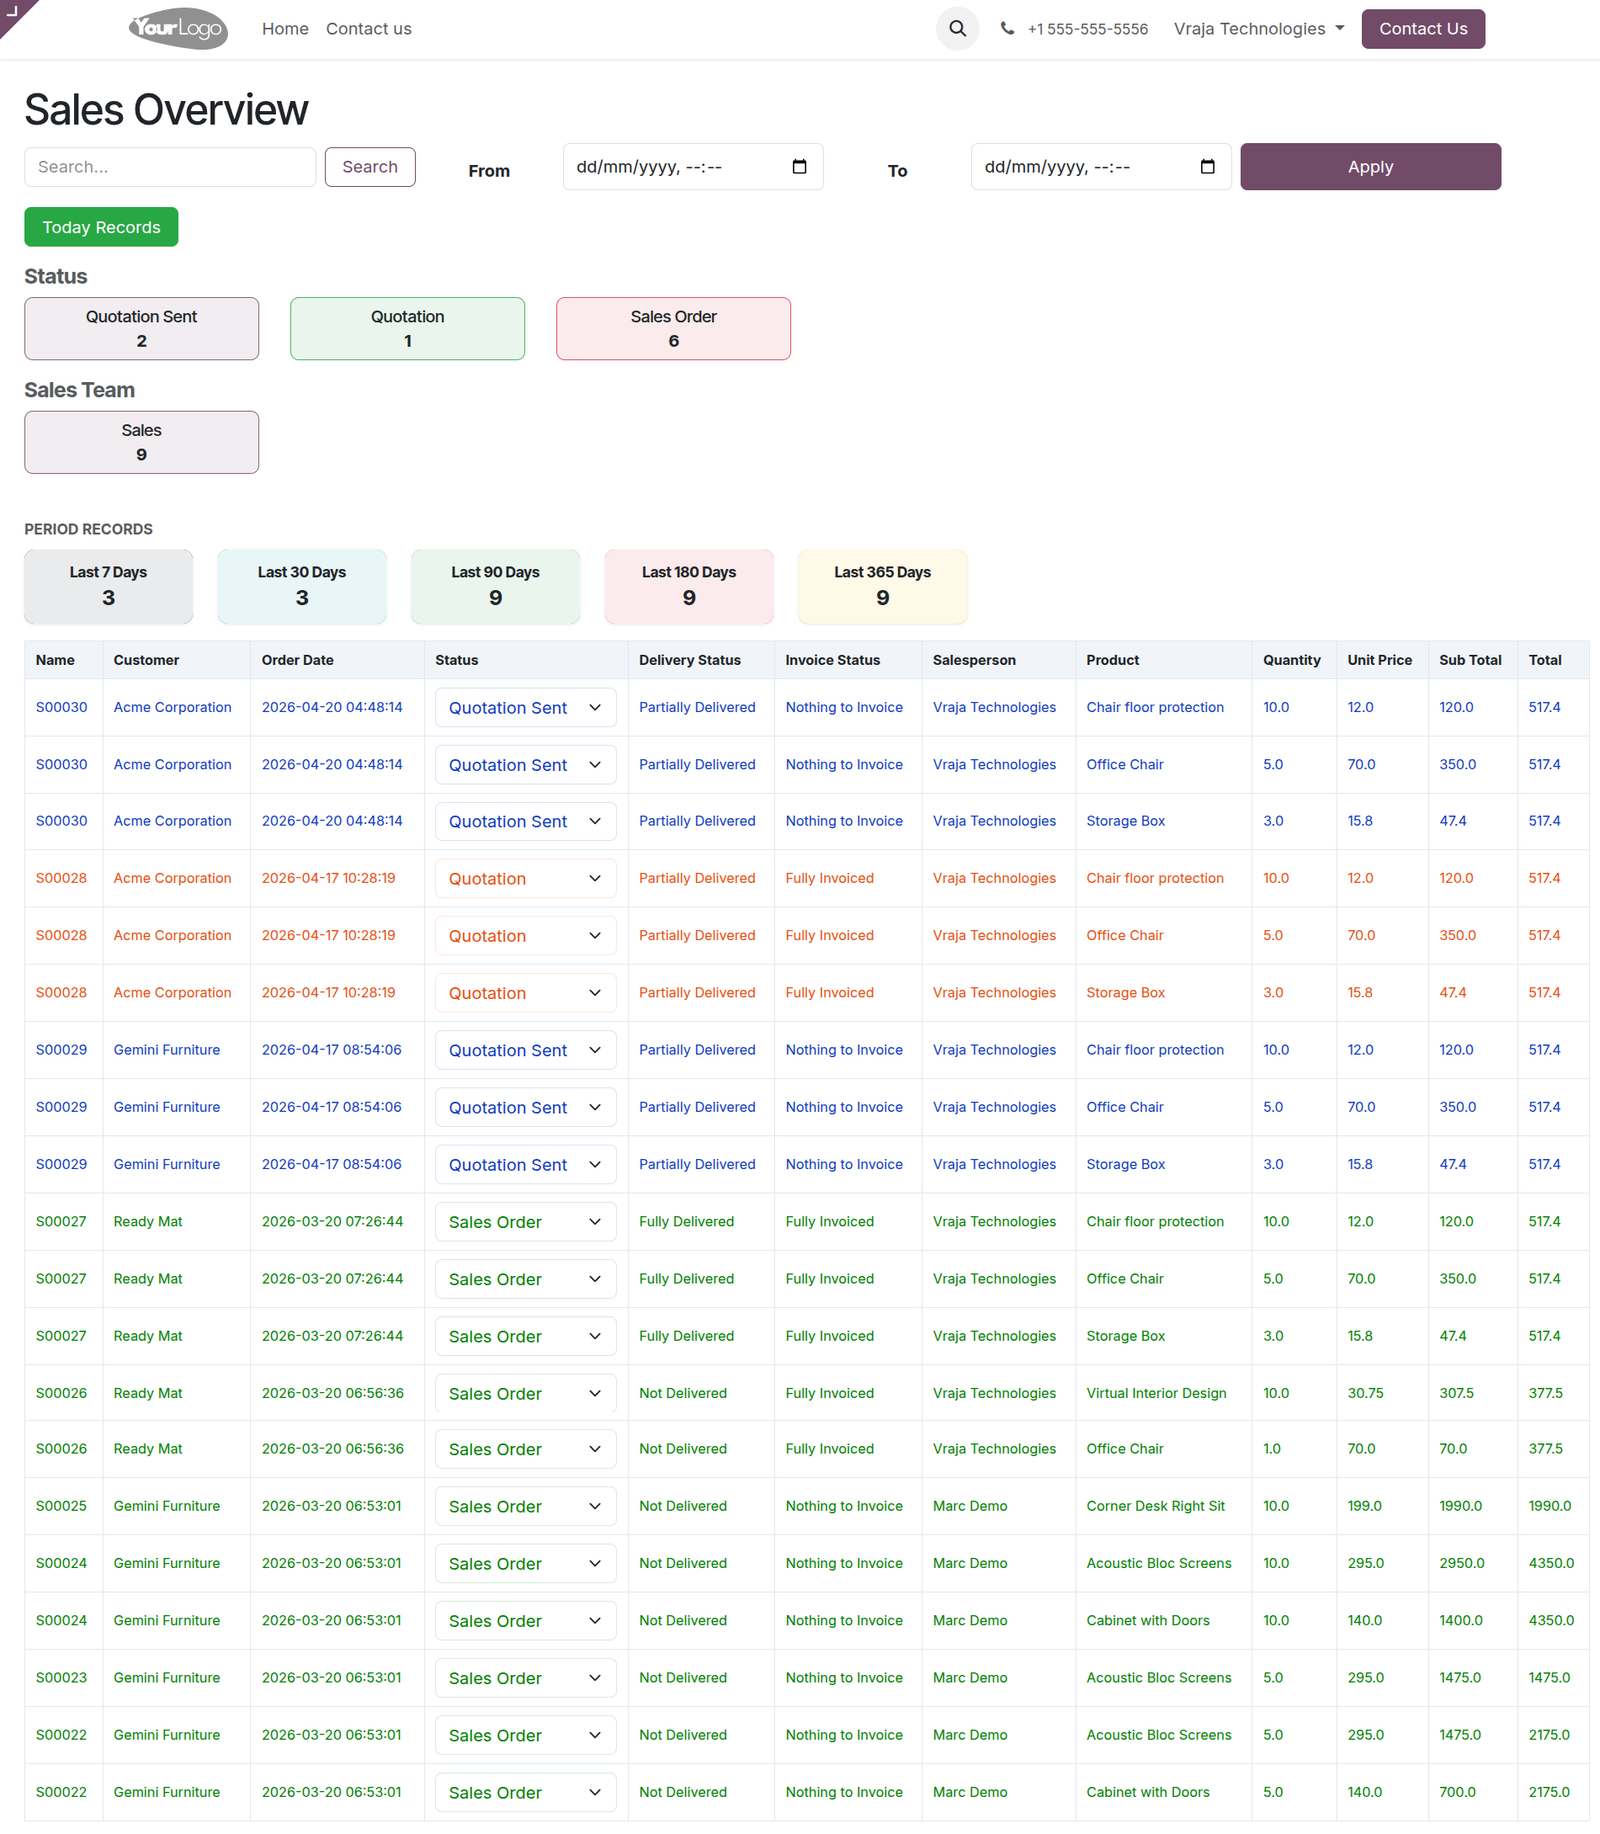
When font colors are configured through color mapping, the dashboard automatically applies the selected styles based on the corresponding field values, creating a more organized, visually clear, and user-friendly data presentation.
Colors are dynamically applied to the corresponding records in the dashboard, enhancing readability and visual distinction.
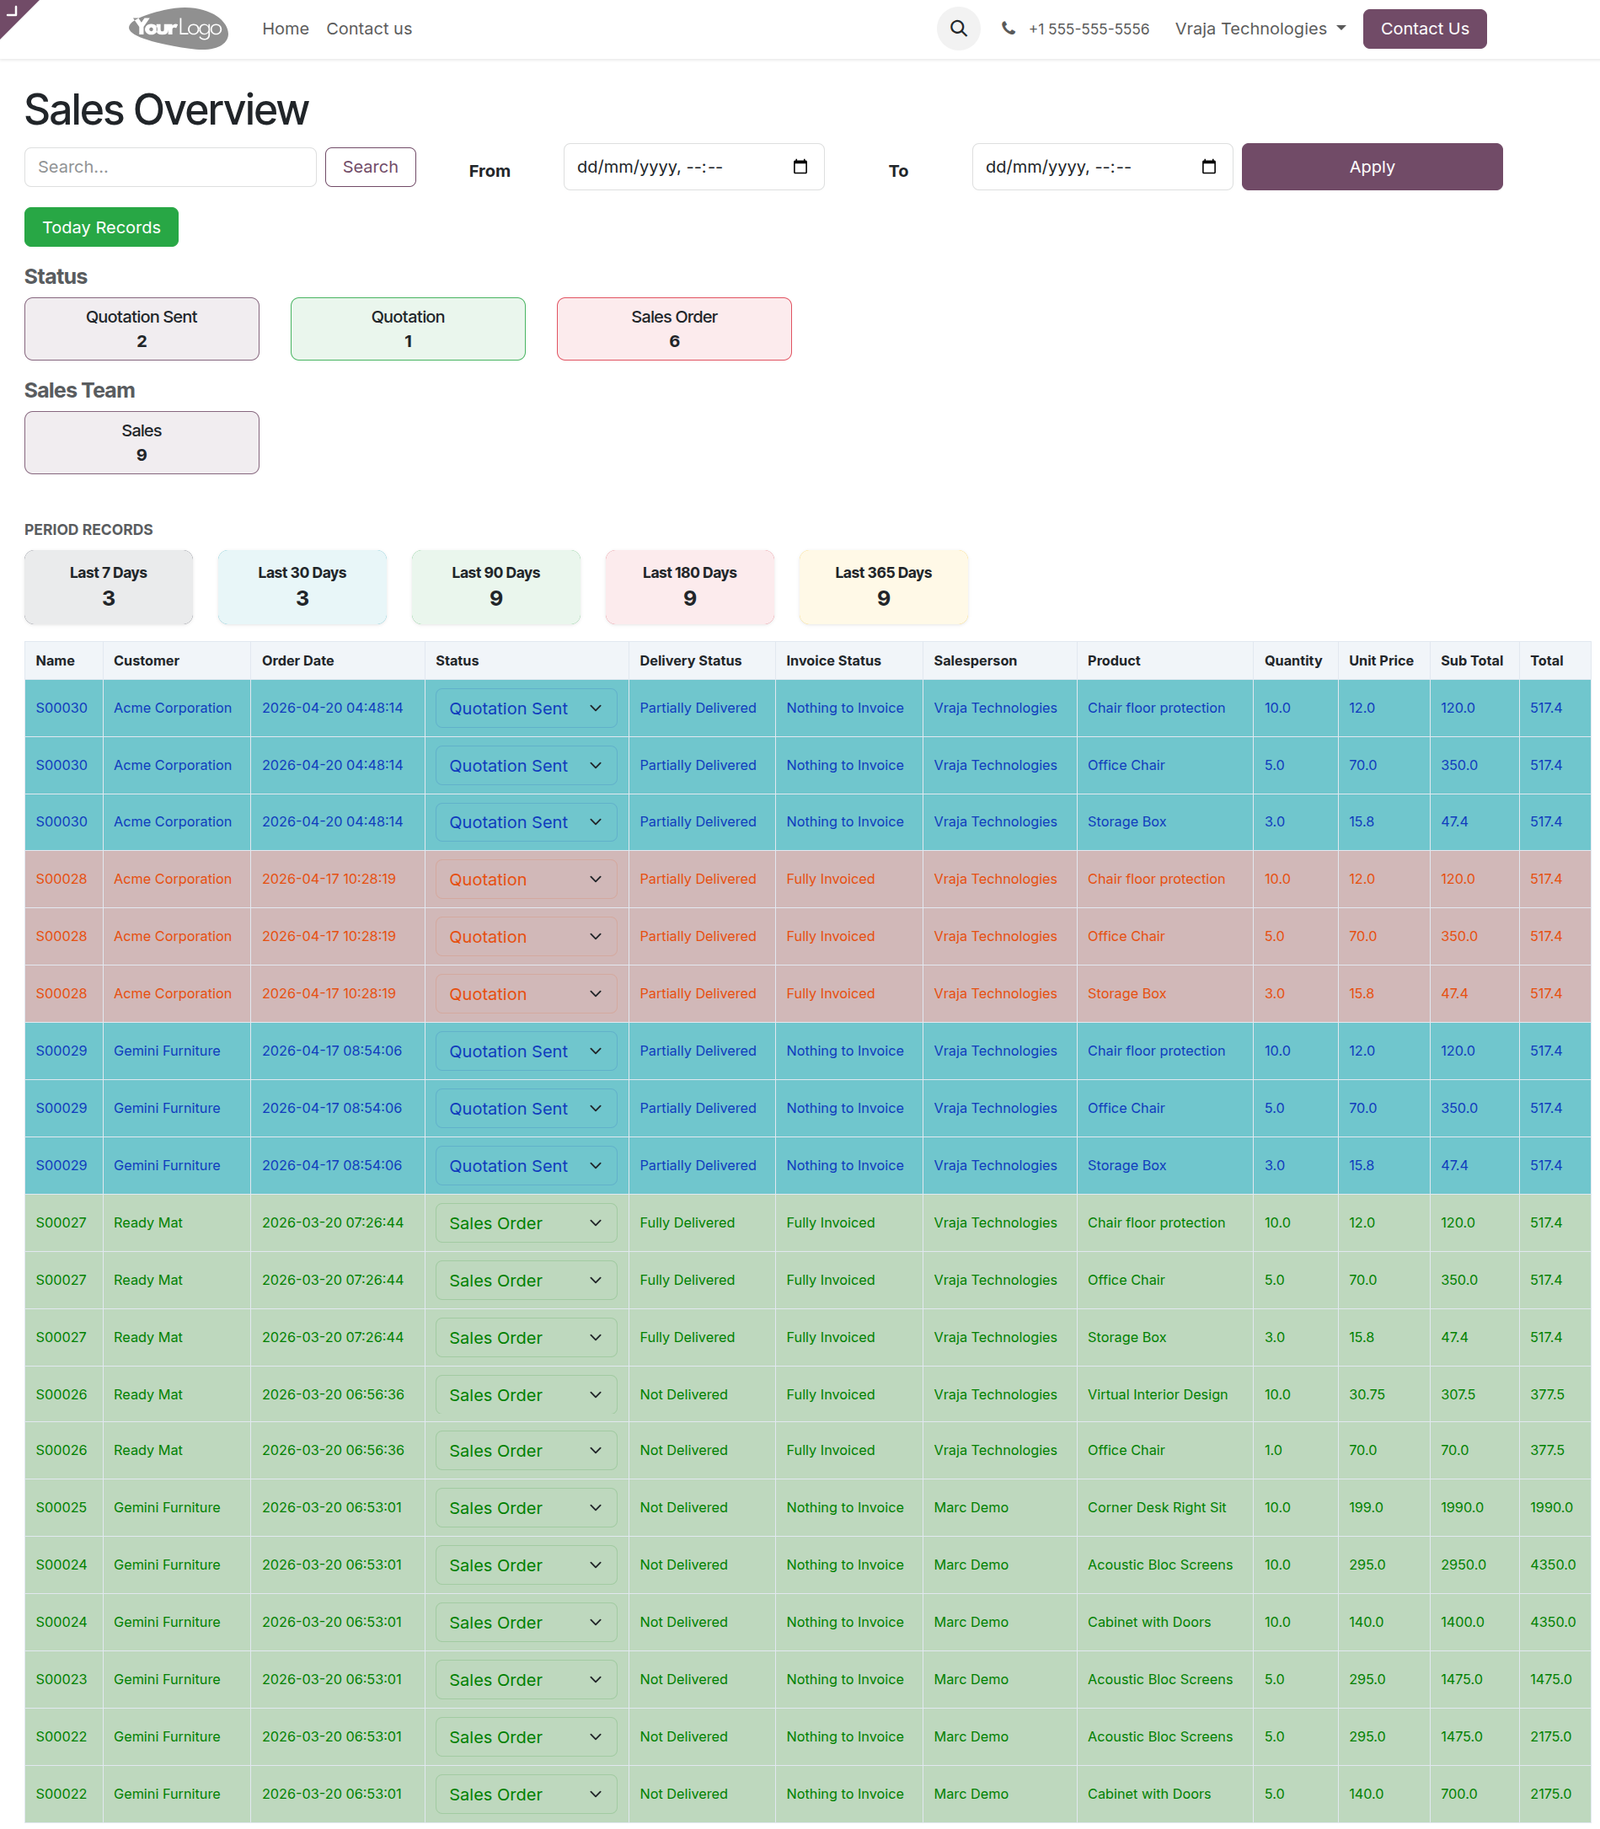
In Color Mapping, you can also configure background colors by assigning specific colors to field values, allowing the dashboard records to display integrated background styling for better visualization.
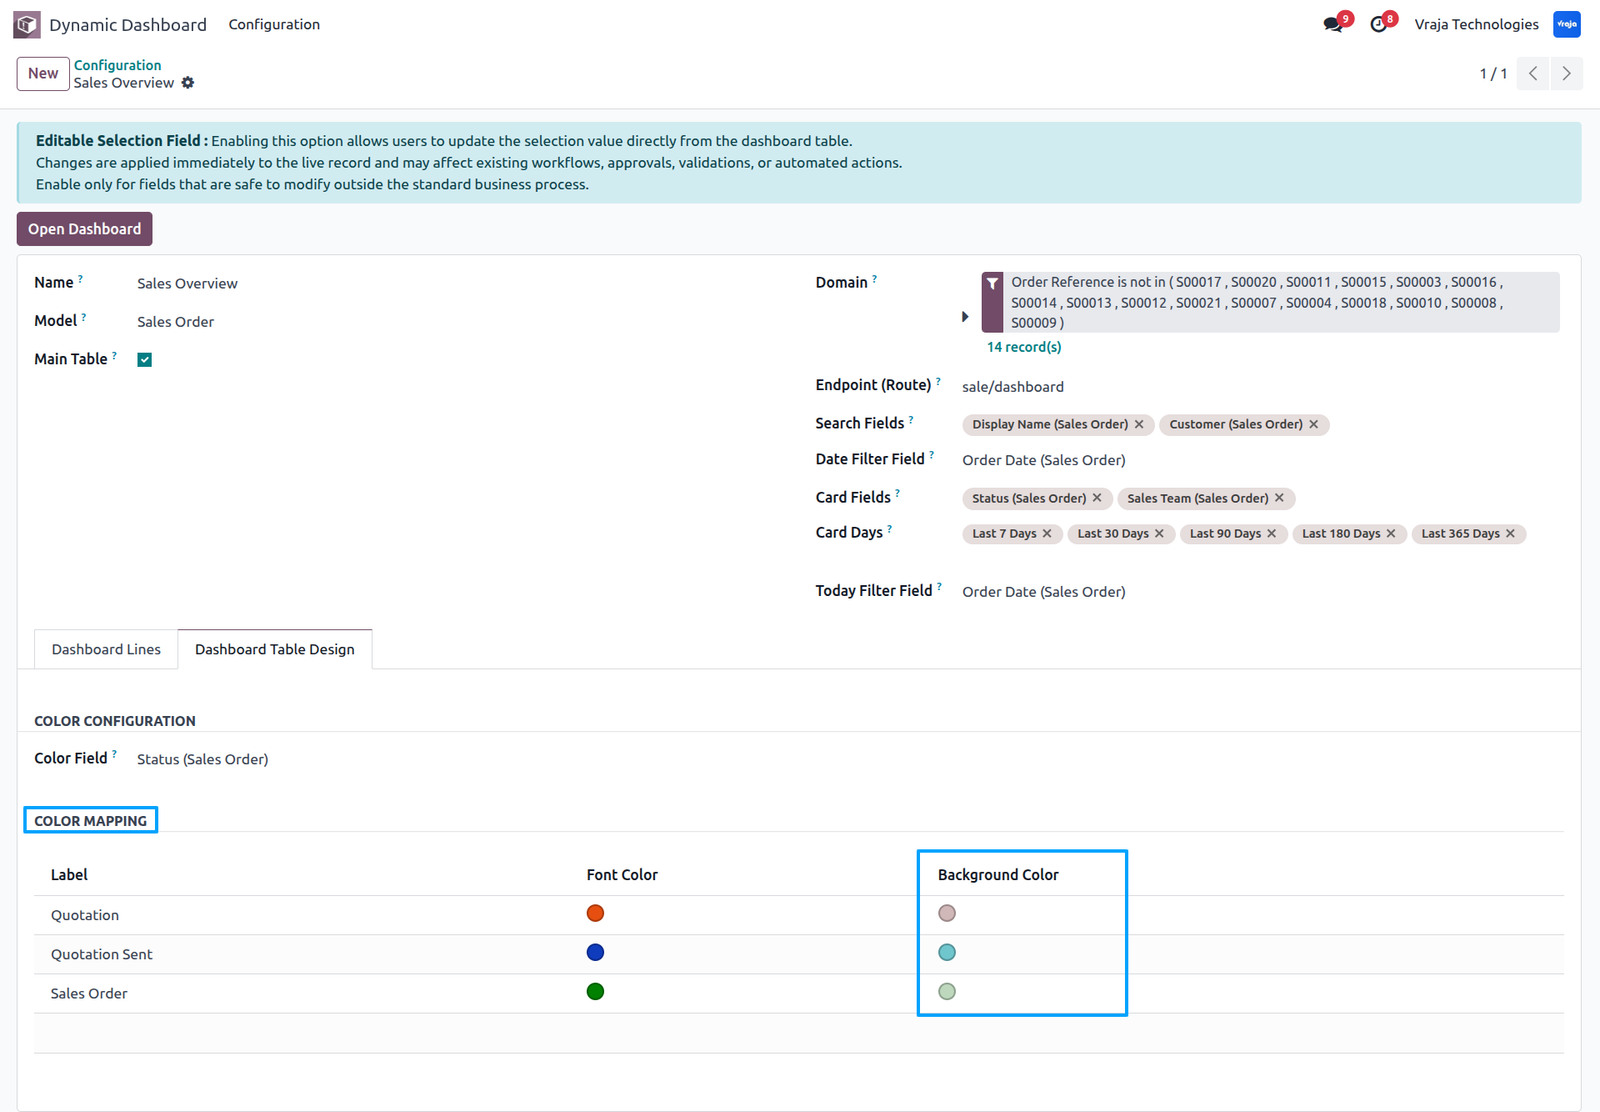
In Color Mapping, you can also configure background colors by assigning specific colors to field values, allowing the dashboard records to display integrated background styling for better visualization.
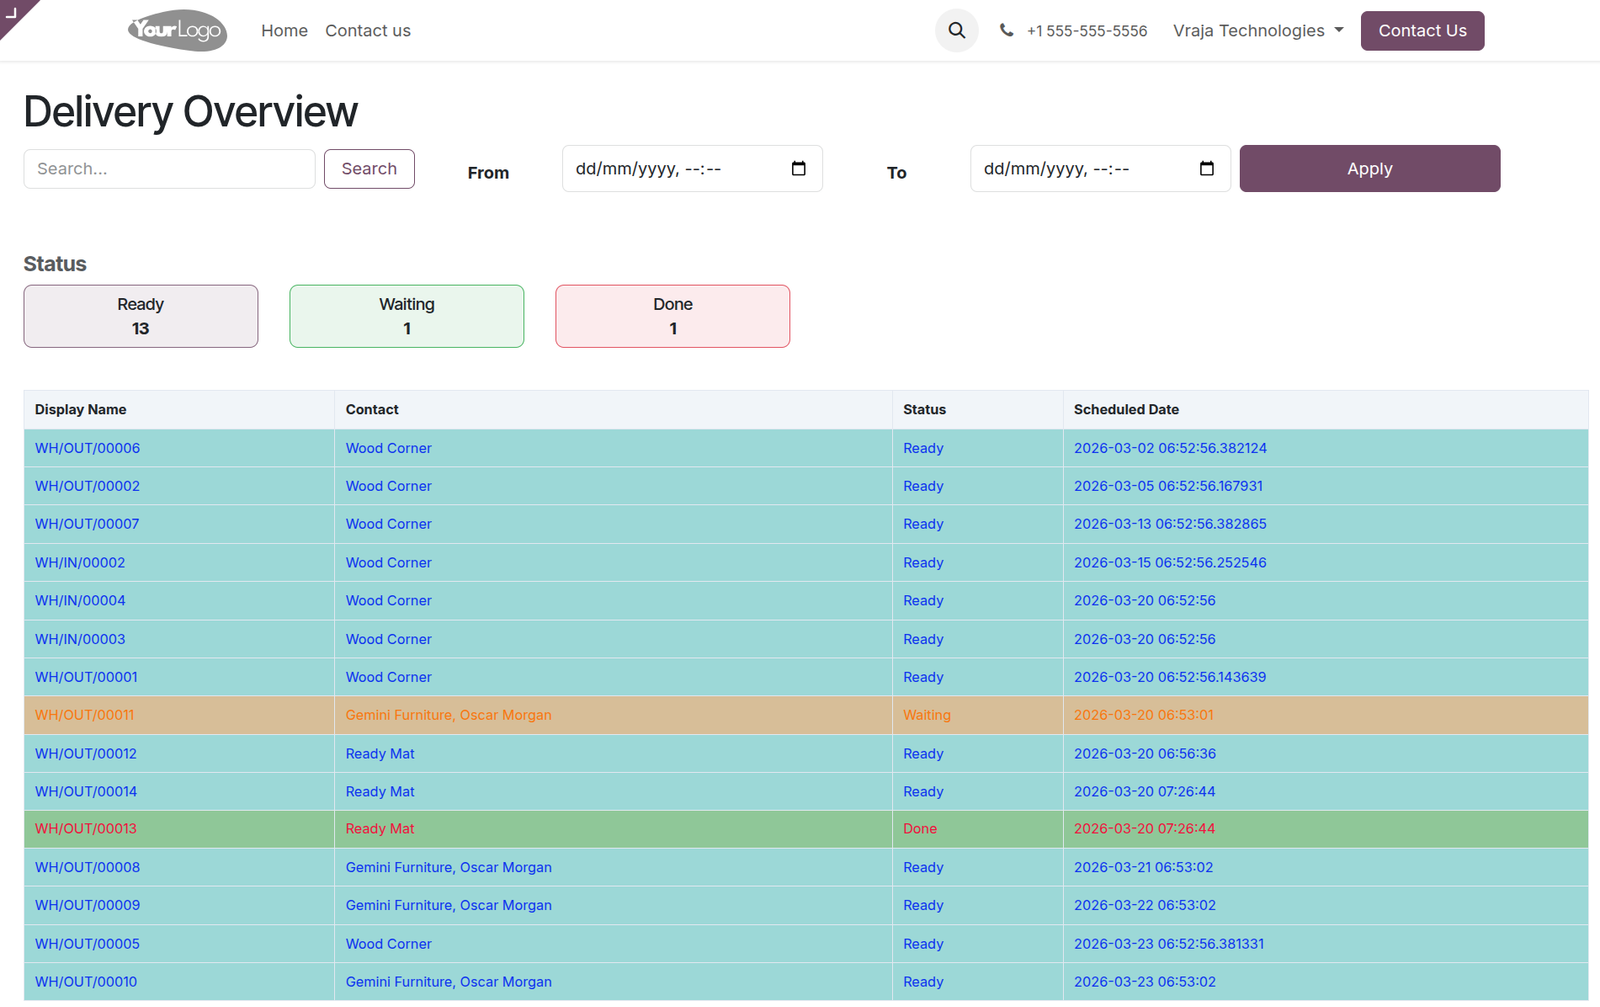
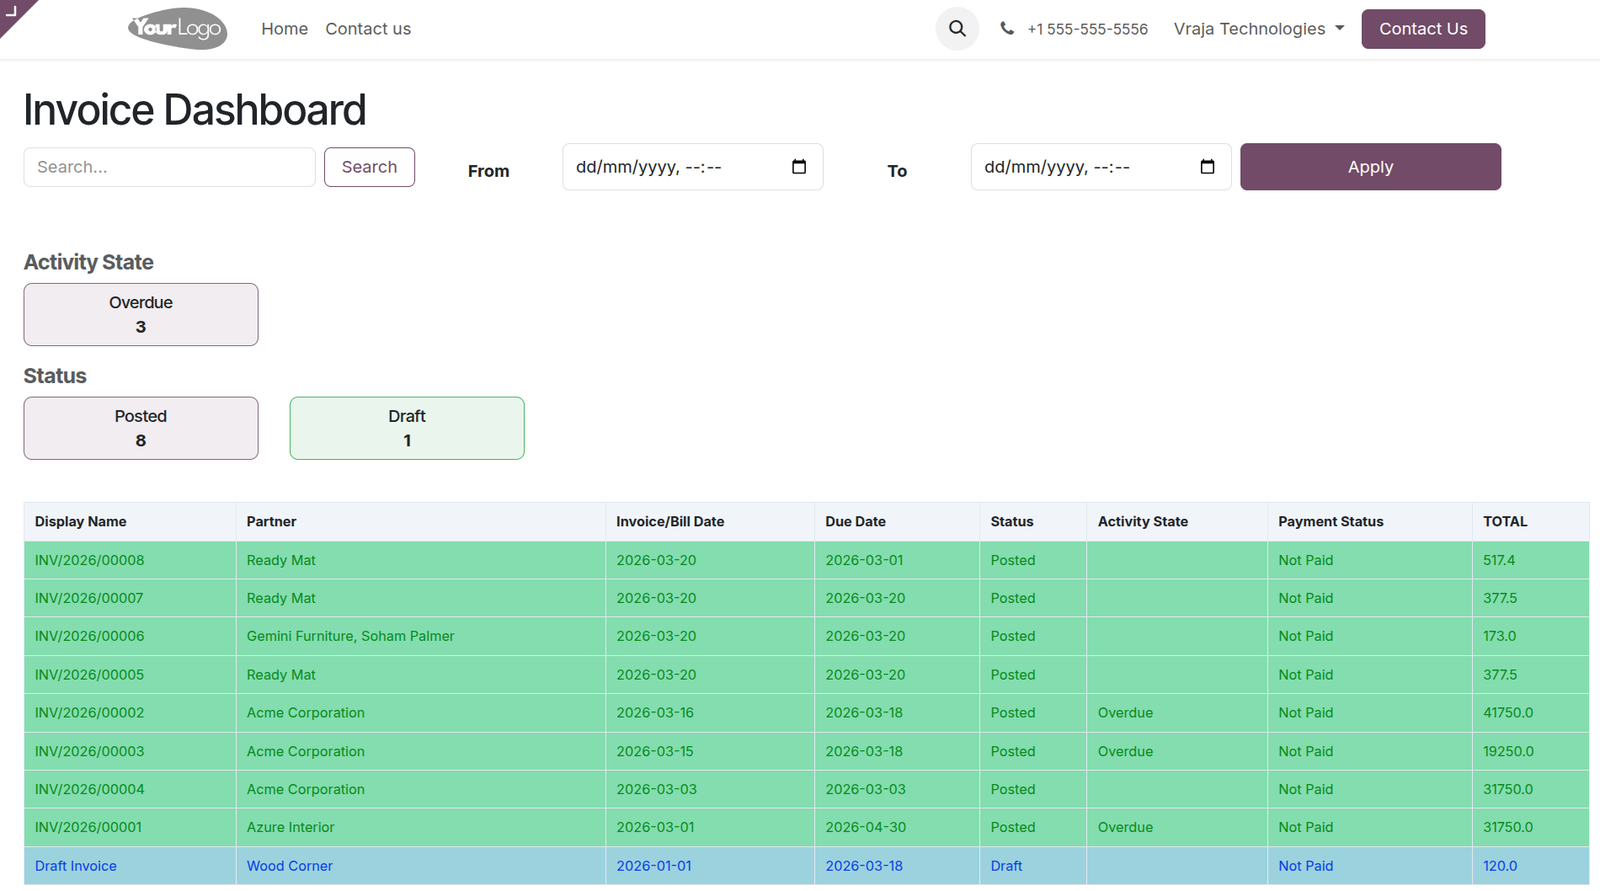
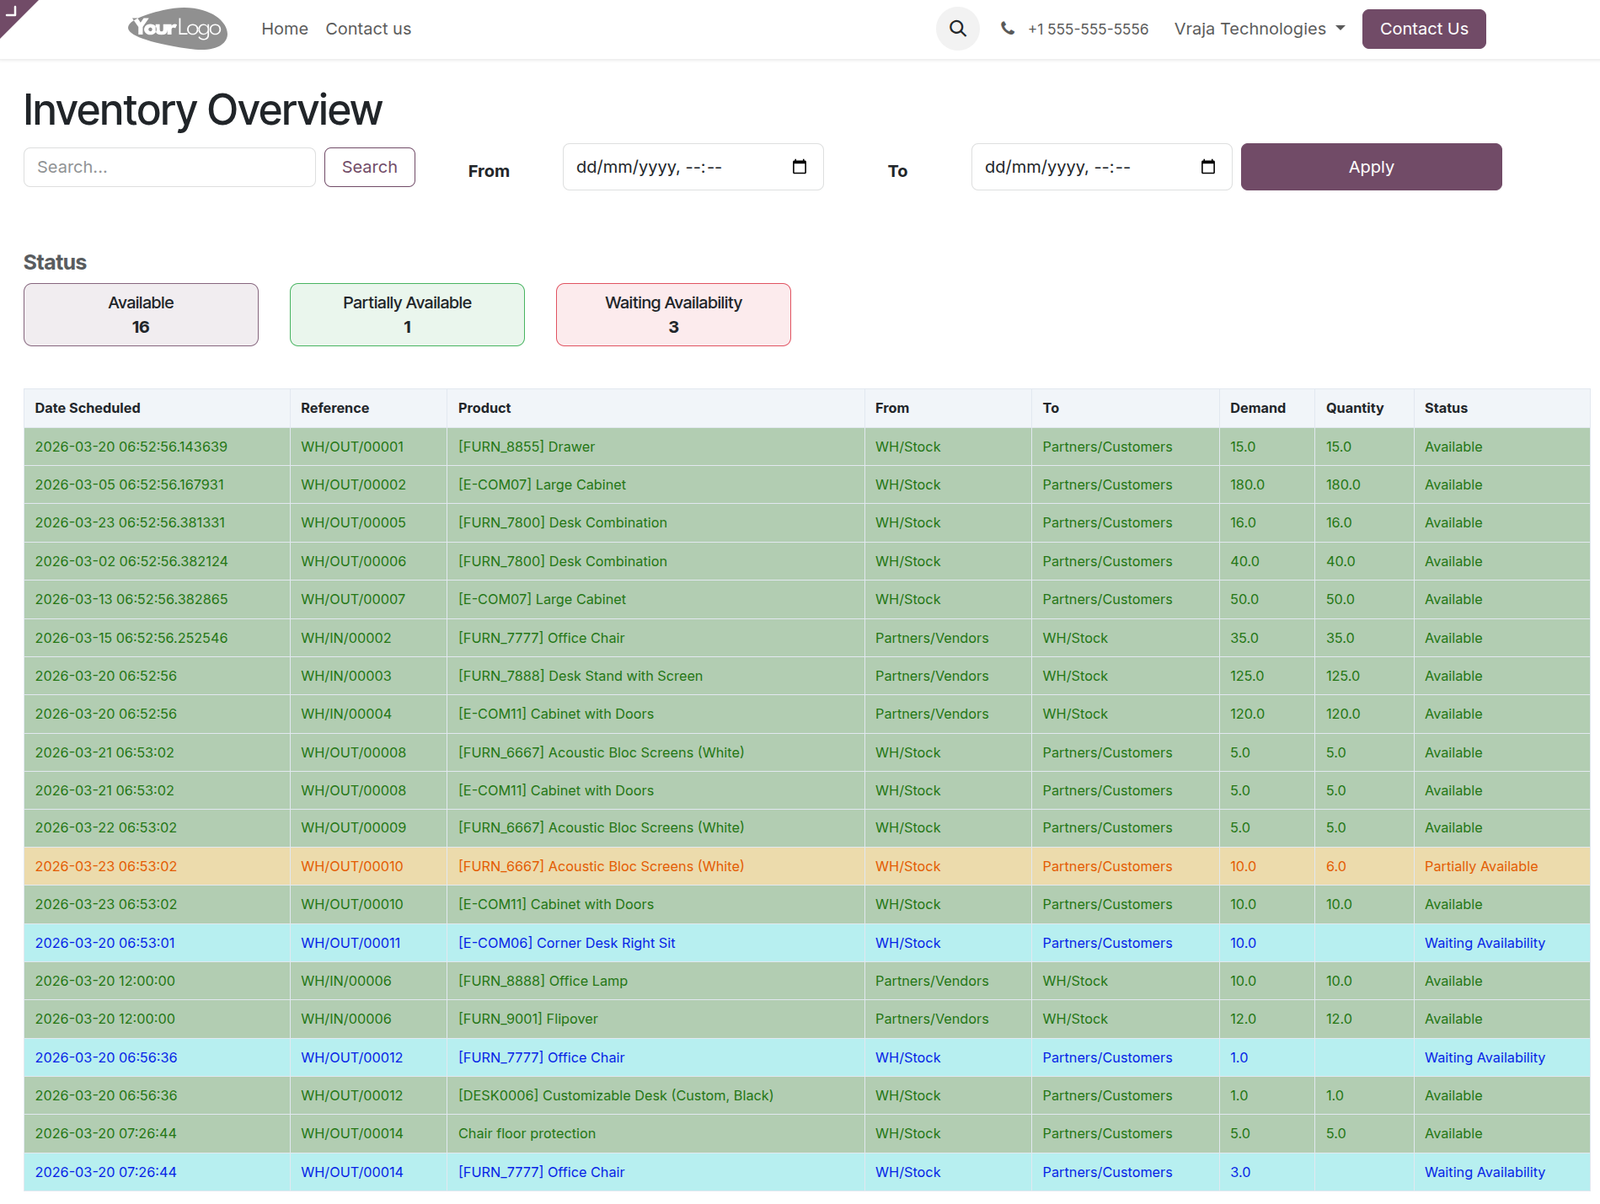
We have real-time dashboards tailored for specific business workflows, enabling users to monitor and analyze data efficiently.
Delivery Overview :
Invoice Dashboard :
Inventory Overview :
 What is the Dynamic Dashboard Builder module?
- It is a no-code solution for creating fully configurable, model-driven dashboards in Odoo. It allows dynamic field selection, relational data handling, calculated columns, and website-based visualization through customizable HTTP routes.
How do I create a new dashboard?
- Go to Dynamic Dashboard → Configuration, click New, select the model, apply domain filters, configure fields in Dashboard Lines, and define an endpoint if it is the main tabl
What is the Main Table option?
- Enabling Main Table marks the dashboard as the primary table. It also enables the endpoint field, allowing access to the dashboard via a URL and providing the Open Dashboard button for quick navigation.
How do I add fields to the dashboard?
- Use the Dashboard Lines section to add fields. You can include normal fields or relational fields (Many2one, One2many, Many2many) and control how related data is displayed.
Can selection fields be edited directly from the dashboard?
- Yes. When Selection Editable is enabled in Dashboard Lines, users can update selection field values directly from the dashboard, and the selected record is updated instantly in real time.
What are sub-dashboards?
- Sub-dashboards are secondary tables used for relational fields. They allow you to display detailed and structured data from related records and should be created without enabling the Main Table option.
What are operational fields?
- Operational fields are calculated columns. You can enable Operational Field, select the operation type (Addition or Multiplication), choose the fields for calculation, and define a custom column name to display the result in the dashboard.
How does the dynamic search filter work?
- You can configure dynamic search filters by selecting multiple fields in the dashboard configuration. The dashboard will filter and display records based on the entered search criteria across those fields.
Can I clear applied search filters?
- Yes. A Clear Filter option is available to remove applied search conditions and restore the full dataset in the dashboard.
Does the dashboard support date-based filtering?
- Yes. You can select any date or datetime field and filter records using a from–to date range, allowing precise time-based data analysis.
Is there a quick option to view today’s records?
- Yes. By configuring the Today Filter Field, users can click the Today Records button on the dashboard to instantly view records for the current day.
What are dashboard cards?
- Dashboard cards display key metrics based on selected fields. Each card shows aggregated information such as record counts, helping users quickly understand important data.
Can I show cards for predefined time periods?
- Yes. You can configure summary cards based on preset periods such as Today, Last 7 Days, Last 30 Days, Last 90 Days, and more. These cards calculate counts using the selected Date Filter Field.
Can I display multiple cards on the dashboard?
- Yes. You can configure and display multiple cards simultaneously to highlight different metrics and insights.
Can I customize the dashboard table design?
- Yes. The Table Design tab allows you to customize the appearance of the table, including applying colors based on field values.
How does color mapping work in the table?
- You can select a color field, and its values will appear in the Color Mapping section. Using the color picker, you can assign colors to each value, which are then dynamically applied to the corresponding records.
Can I apply background colors using Color Mapping?
- Yes. In addition to font colors, Color Mapping also supports background colors. The dashboard dynamically applies the configured background color to matching records for better visibility and styling.
Can I customize column names?
- Yes. You can define custom column names for both normal and operational fields to make the dashboard table more user-friendly and descriptive.
How do I access the dashboard?
- Once configured, click the Open Dashboard button or access it via the defined endpoint URL. The dashboard will display all configured fields, filters, cards, and table designs.
I would like to request a custom feature for this application. What’s the process to get it implemented?
- We’re happy to help tailor the application to meet your business needs! You can reach us via sales@vrajatechnologies.com
Who is the point of contact for technical support, configuration support or bug-related queries?
- You can reach us via support@vrajatechnologies.com
Submit a Support Ticket
If you encounter any issues while using our app that are caused by the app itself, we offer complimentary support for 90 days from the date of purchase.
To create a support ticket, please register via the Vraja Technologies Support Email and provide the necessary details so we can assist you in resolving the issue.

Email Us
support@vrajatechnologies.com

 1.png)
Contact Us
vrajatechnologies.com/contactus

Support
vrajatechnologies.com/support-policy
Vraja Technologies Services

Odoo Implementation

Odoo App Integration Services

Odoo Customization

Odoo Consultation

Odoo Support & Maintenance

Odoo Developer Outsourcing
Suggested Application


Reviews
There are no reviews yet.